Better Hitting in Colleges, Part 2
More Case Studies from uHIT Training in College Programs
One Softball and One Baseball Team
August 1, 2023
Brown University Baseball (D1) and Crown College Softball(D3)
Below, we look at each of their improvements and unpack how they used uHIT Custom.

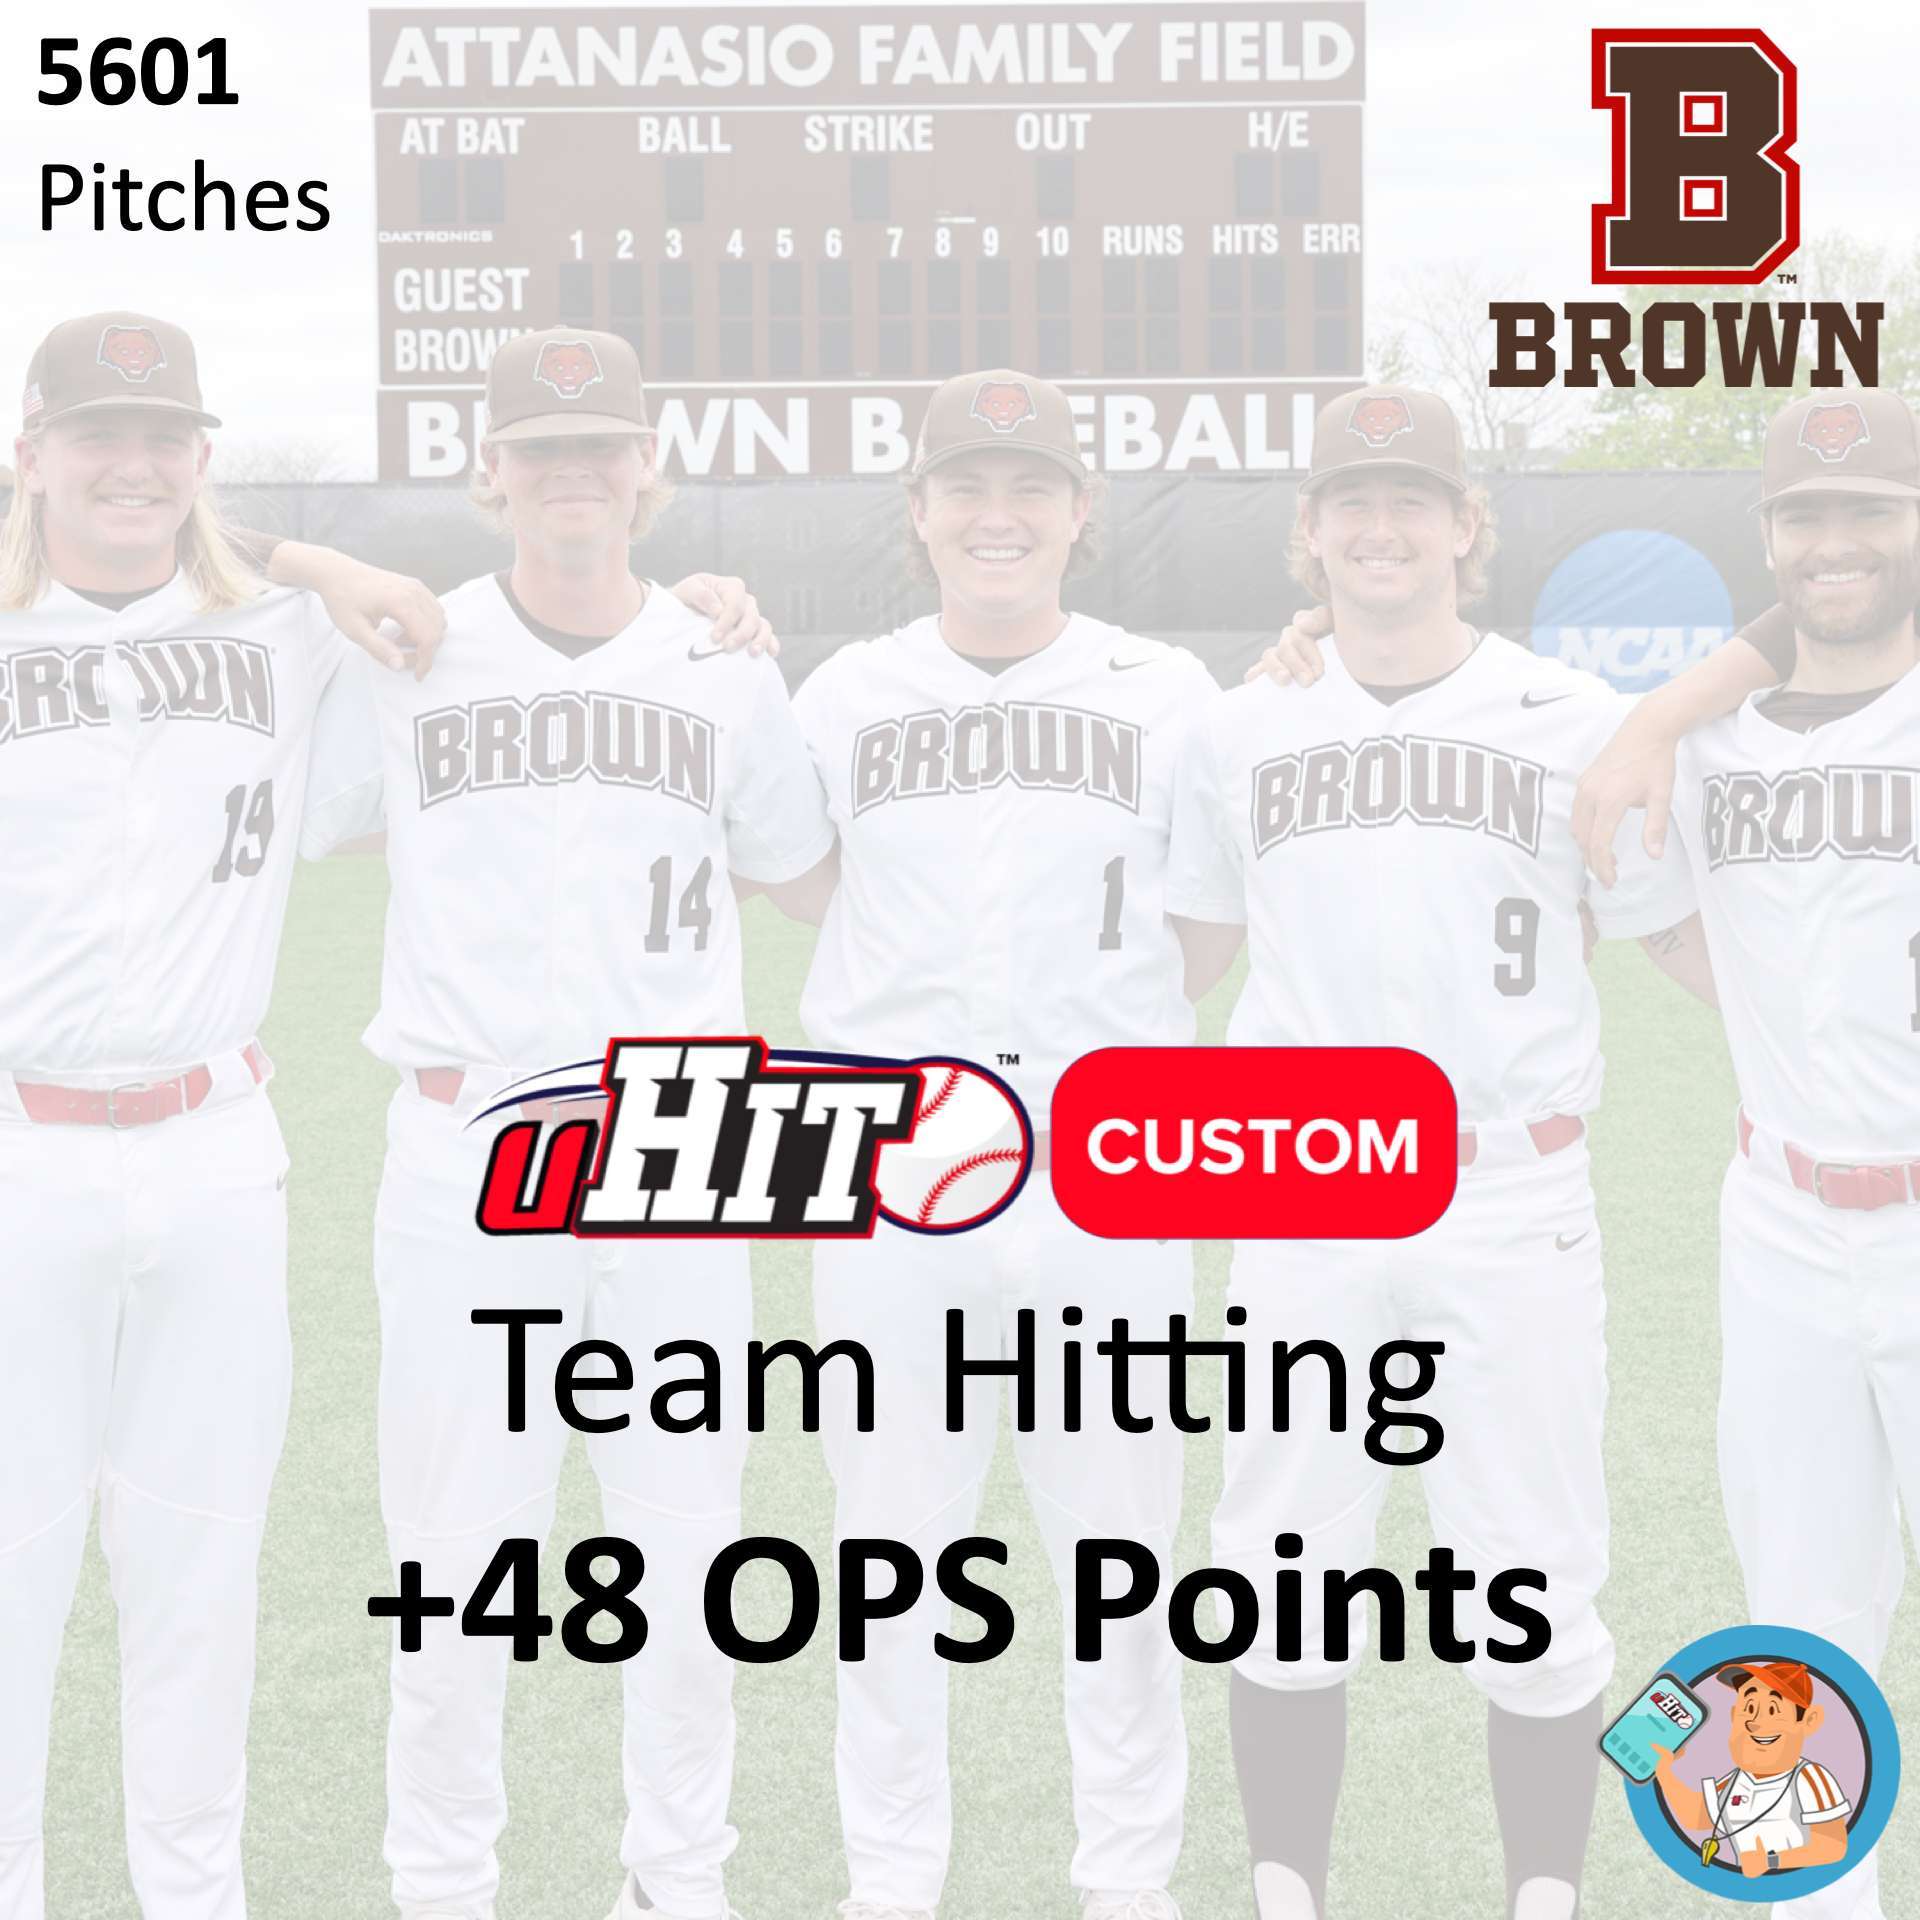
Brown University Baseball | +48 OPS Points
In Fall 2021, Brown University Baseball and Head Coach Grant Achilles took a new approach to fall training. Achilles implemented uHIT Custom Training, starting with 25 hitters going through Zone and Pitch Recognition Assessments for baselines. (You can learn more about uHIT Baselines by level of play from here)
As with any training protocol, some will stick with the program, while others will fall off. And Brown Baseball was no different than any other program in this regard. But the players that stuck with the program contributed positively to their team’s hitting the following spring. How do we evaluate this team-level change?
Evaluating Team-Level Assessment
Before we look at on-field, let’s look at what we saw in uHIT. All players did the Zone and Pitch Recognition Assessments in uHIT Baseball (to learn more about Pitch Recognition Assessments, click here; to learn more about Zone Recognition Assessments, click here). Each Assessment is built on 60 pitches, at the end of which we get an Accuracy and Reaction Time measurement. If you’re a user of uHIT, you will notice points (or XP) popping up after each pitch too. These XP are a per pitch measurement of your Accuracy and Reaction Time. So we will focus on XP as a summary measurement of Pitch and Zone Recognition skills.
Across the team, each player produced an XP Per Pitch average. This value tells us how accurately AND quickly a player recognizes balls/strikes and different pitches. We can get a team average XP Per Pitch by simply averaging all players’ values who did the Assessment. Each did 60 pitches so they can all be weighted the same. Using that approach, we find a team XP Per Pitch of 30.5 XP Per Pitch for Pitch Recognition, and 30.9 XP Per Pitch for Zone Recognition.
Evaluating Team-Level Training Effect
Now, we look at whether uHIT Custom Training moved the needle from this baseline. But some players did a lot of work in uHIT, while others fell off. How do we account for this difference? For instance, we cannot just take an average of all players’ XP Per Pitch in Training, since some did a lot of work while others did not.
To handle this variability, we use something called the “dot product” (see more here and how to implement here). To illustrate, let’s look at three players: Nathan, Josh and Quinn. Nathan did 471 pitches of Training. Josh did 70 pitches of Training. And Quinn did 723 pitches. These three players did differing amounts of training, so their contribution to the overall team XP Per Pitch (from training alone) should be different.
Now, let’s look at their performance in training. Nathan at 73 XP Per Pitch. Josh had 72 XP Per Pitch, and Quinn had 39 XP Per Pitch. So all three players were about the same as individuals on Pitch Recognition. But when we dot-product these numbers with the pitches for each of them, and normalize by the sum total of pitches they did, we see that across these three players they performed at 53 XP Per Pitch. Clearly, this group calculation gives weight to the many pitches at lower performance done by Quinn. But it’s a more accurate reflection of how those three players performed as a group in training.
We can now apply that strategy to all players who did uHIT Custom Training in Pitch Recognition (22 players). Doing so, we get a team-level performance of 53 XP Per Pitch. In Zone Recognition, we saw team-level performance jump to 75 XP Per Pitch.
Recapping Assessment to Training Improvements in uHIT
Summarizing that all for you, the team began Pitch and Zone Recognition Assessments as follows:
- Pitch Recognition Assessments: 30.5 XP Per Pitch
- Zone Recognition Assessments: 30.9 XP Per Pitch
After 4-8 weeks of training, the team performed at Pitch and Zone Recognition Training as follows:
- Pitch Recognition Training: 53.4 XP Per Pitch (+75% Increase)
- Zone Recognition Training: 75.3 XP Per Pitch (+144% Increase)
Now we will look at whether this learning translated to the plate the following season.
Recapping Assessment to Training Improvements in uHIT
2020 was a shortened season, but fortunately we had sufficient sample size to evaluate hitting performance (393 total ABs). There was no 2021 season due to COVID-19 rules. And so were forced to look at performance in 2022 on-field baselined to the shortened 2020 season.
-
OPS in 2020 | .661
-
OPS in 2022 | .709
We can breakdown OPS into its component parts to see where the changes translated most. The 2020 OBP was .323, compared to the 2022 OBP of .344. And the 2020 SLG was .338, compared to the 2022 SLG of .365. Both small decisions like taking pitches (OBP effects) and big decisions like driving the ball (SLG effects) played out on Brown Baseball in 2022. And this accompanied their +75-144% increase in performance on uHIT Custom Training.
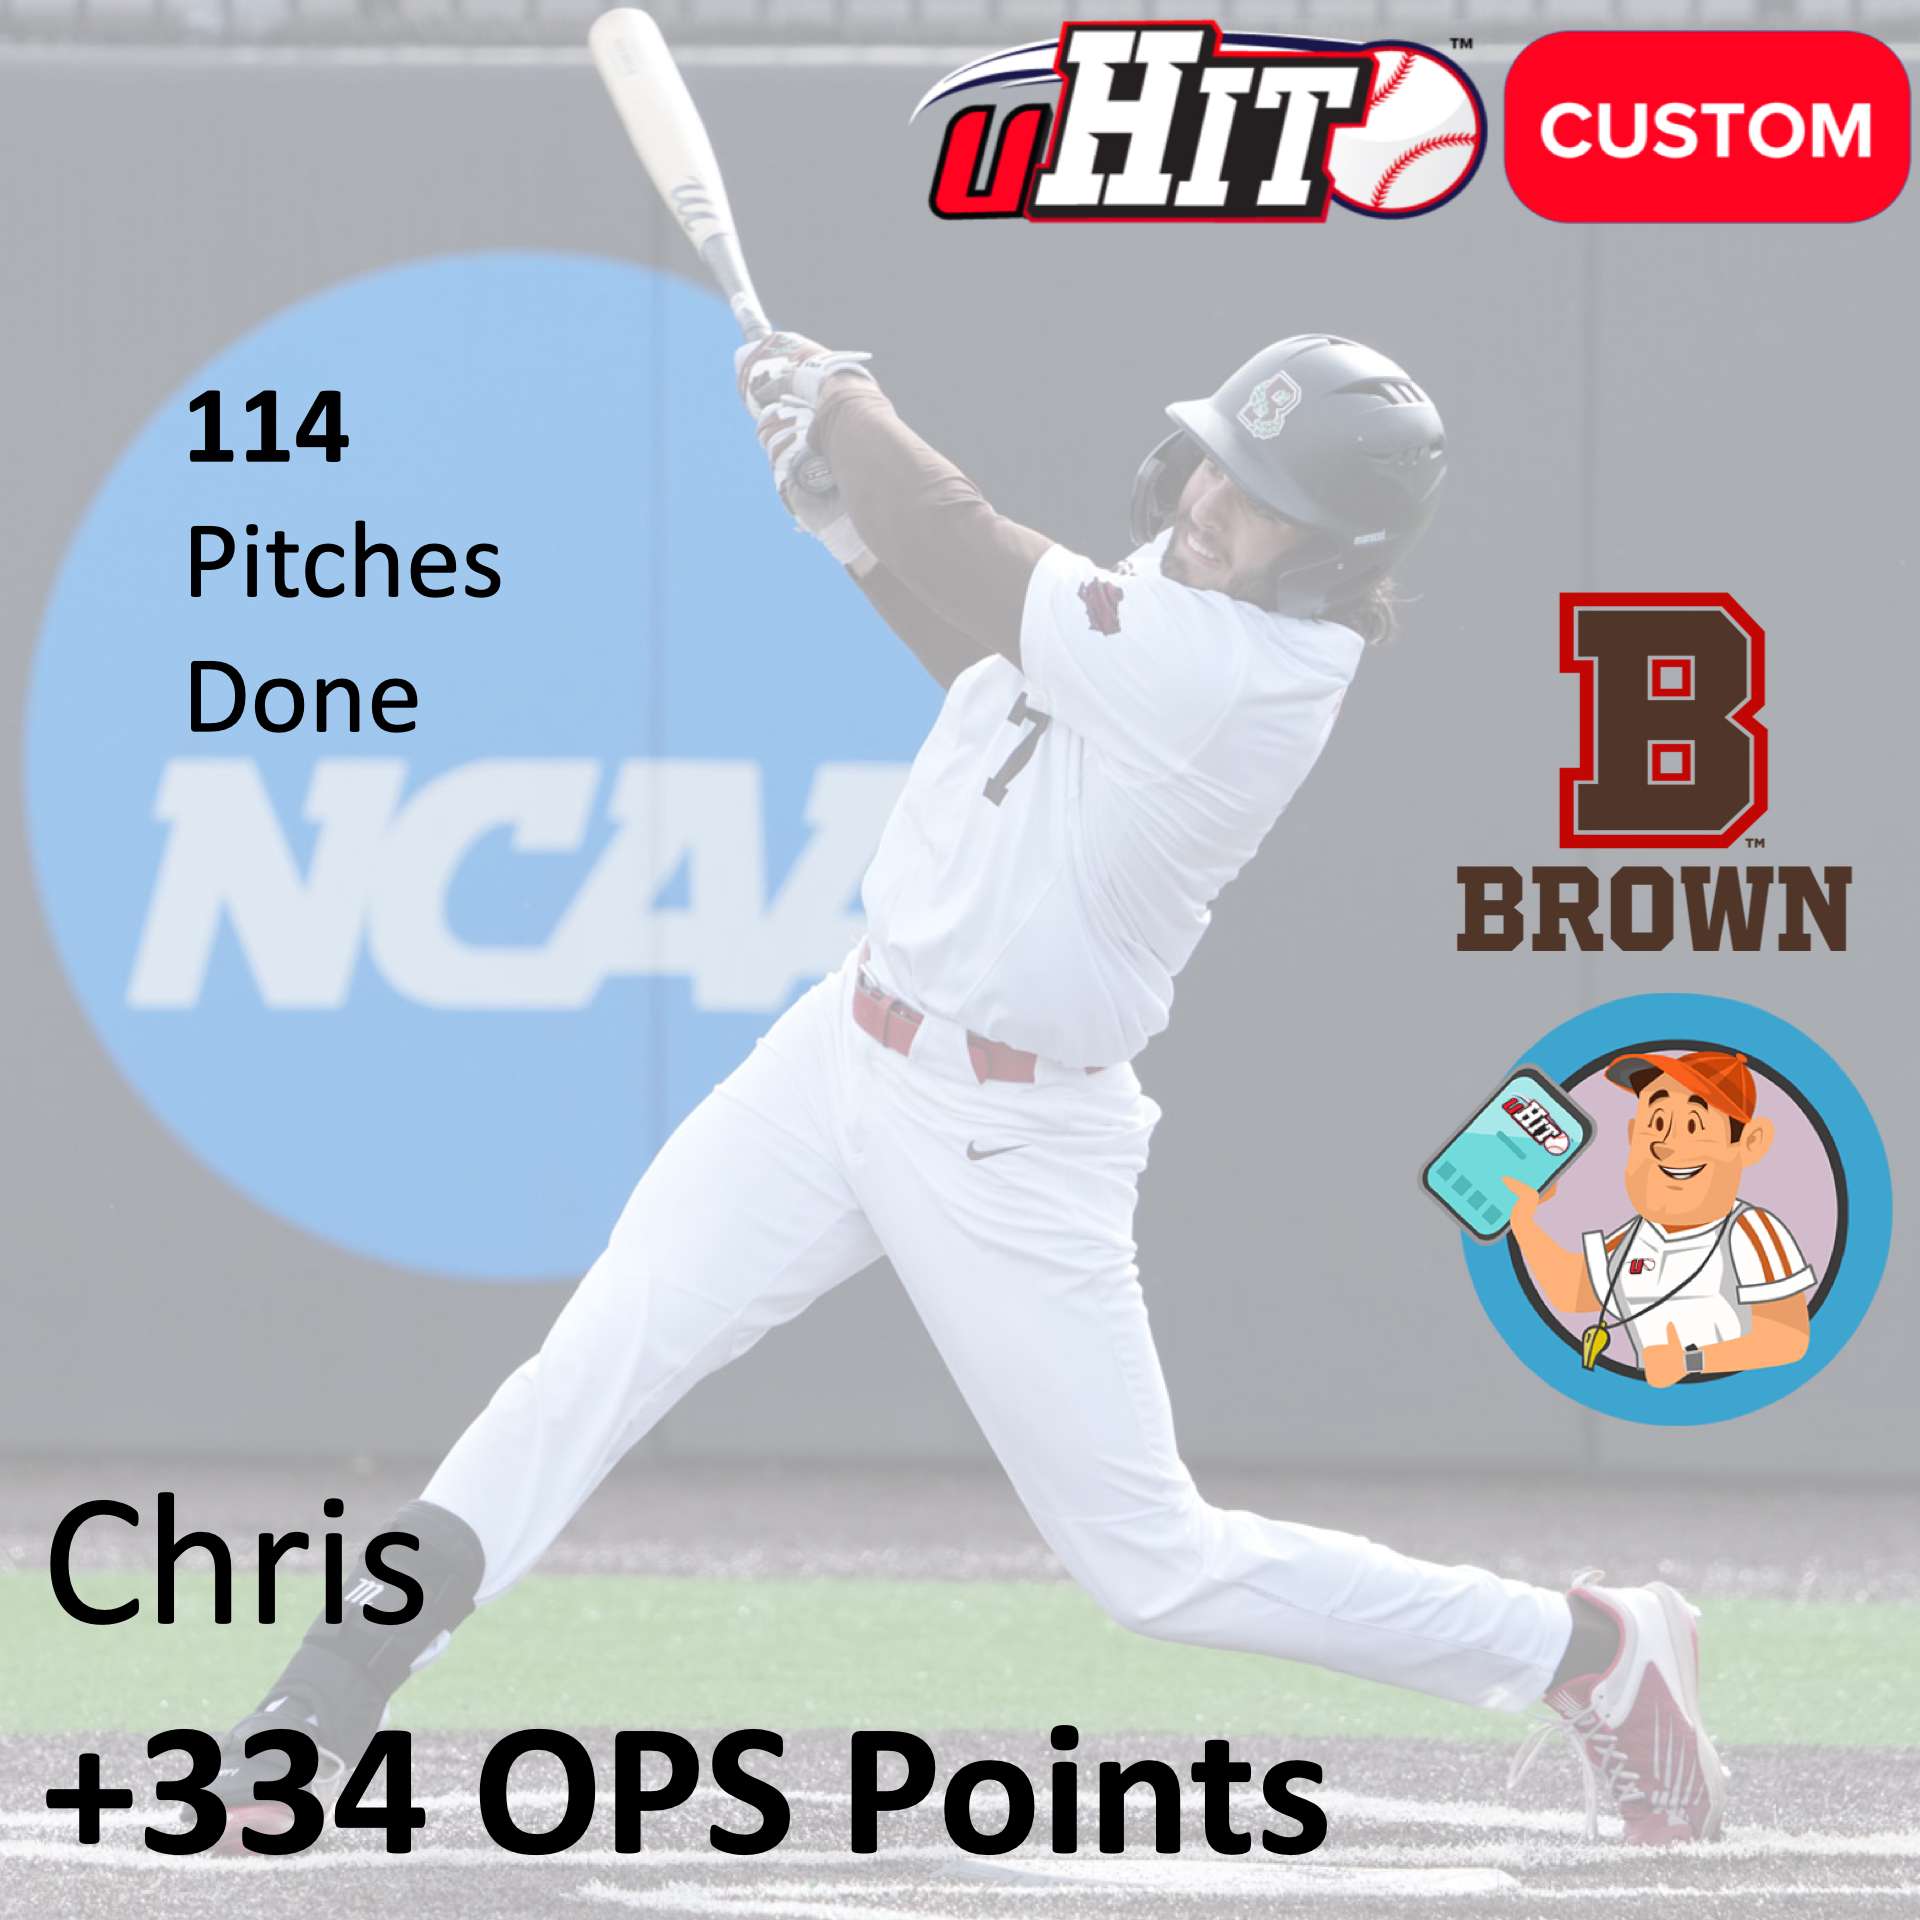
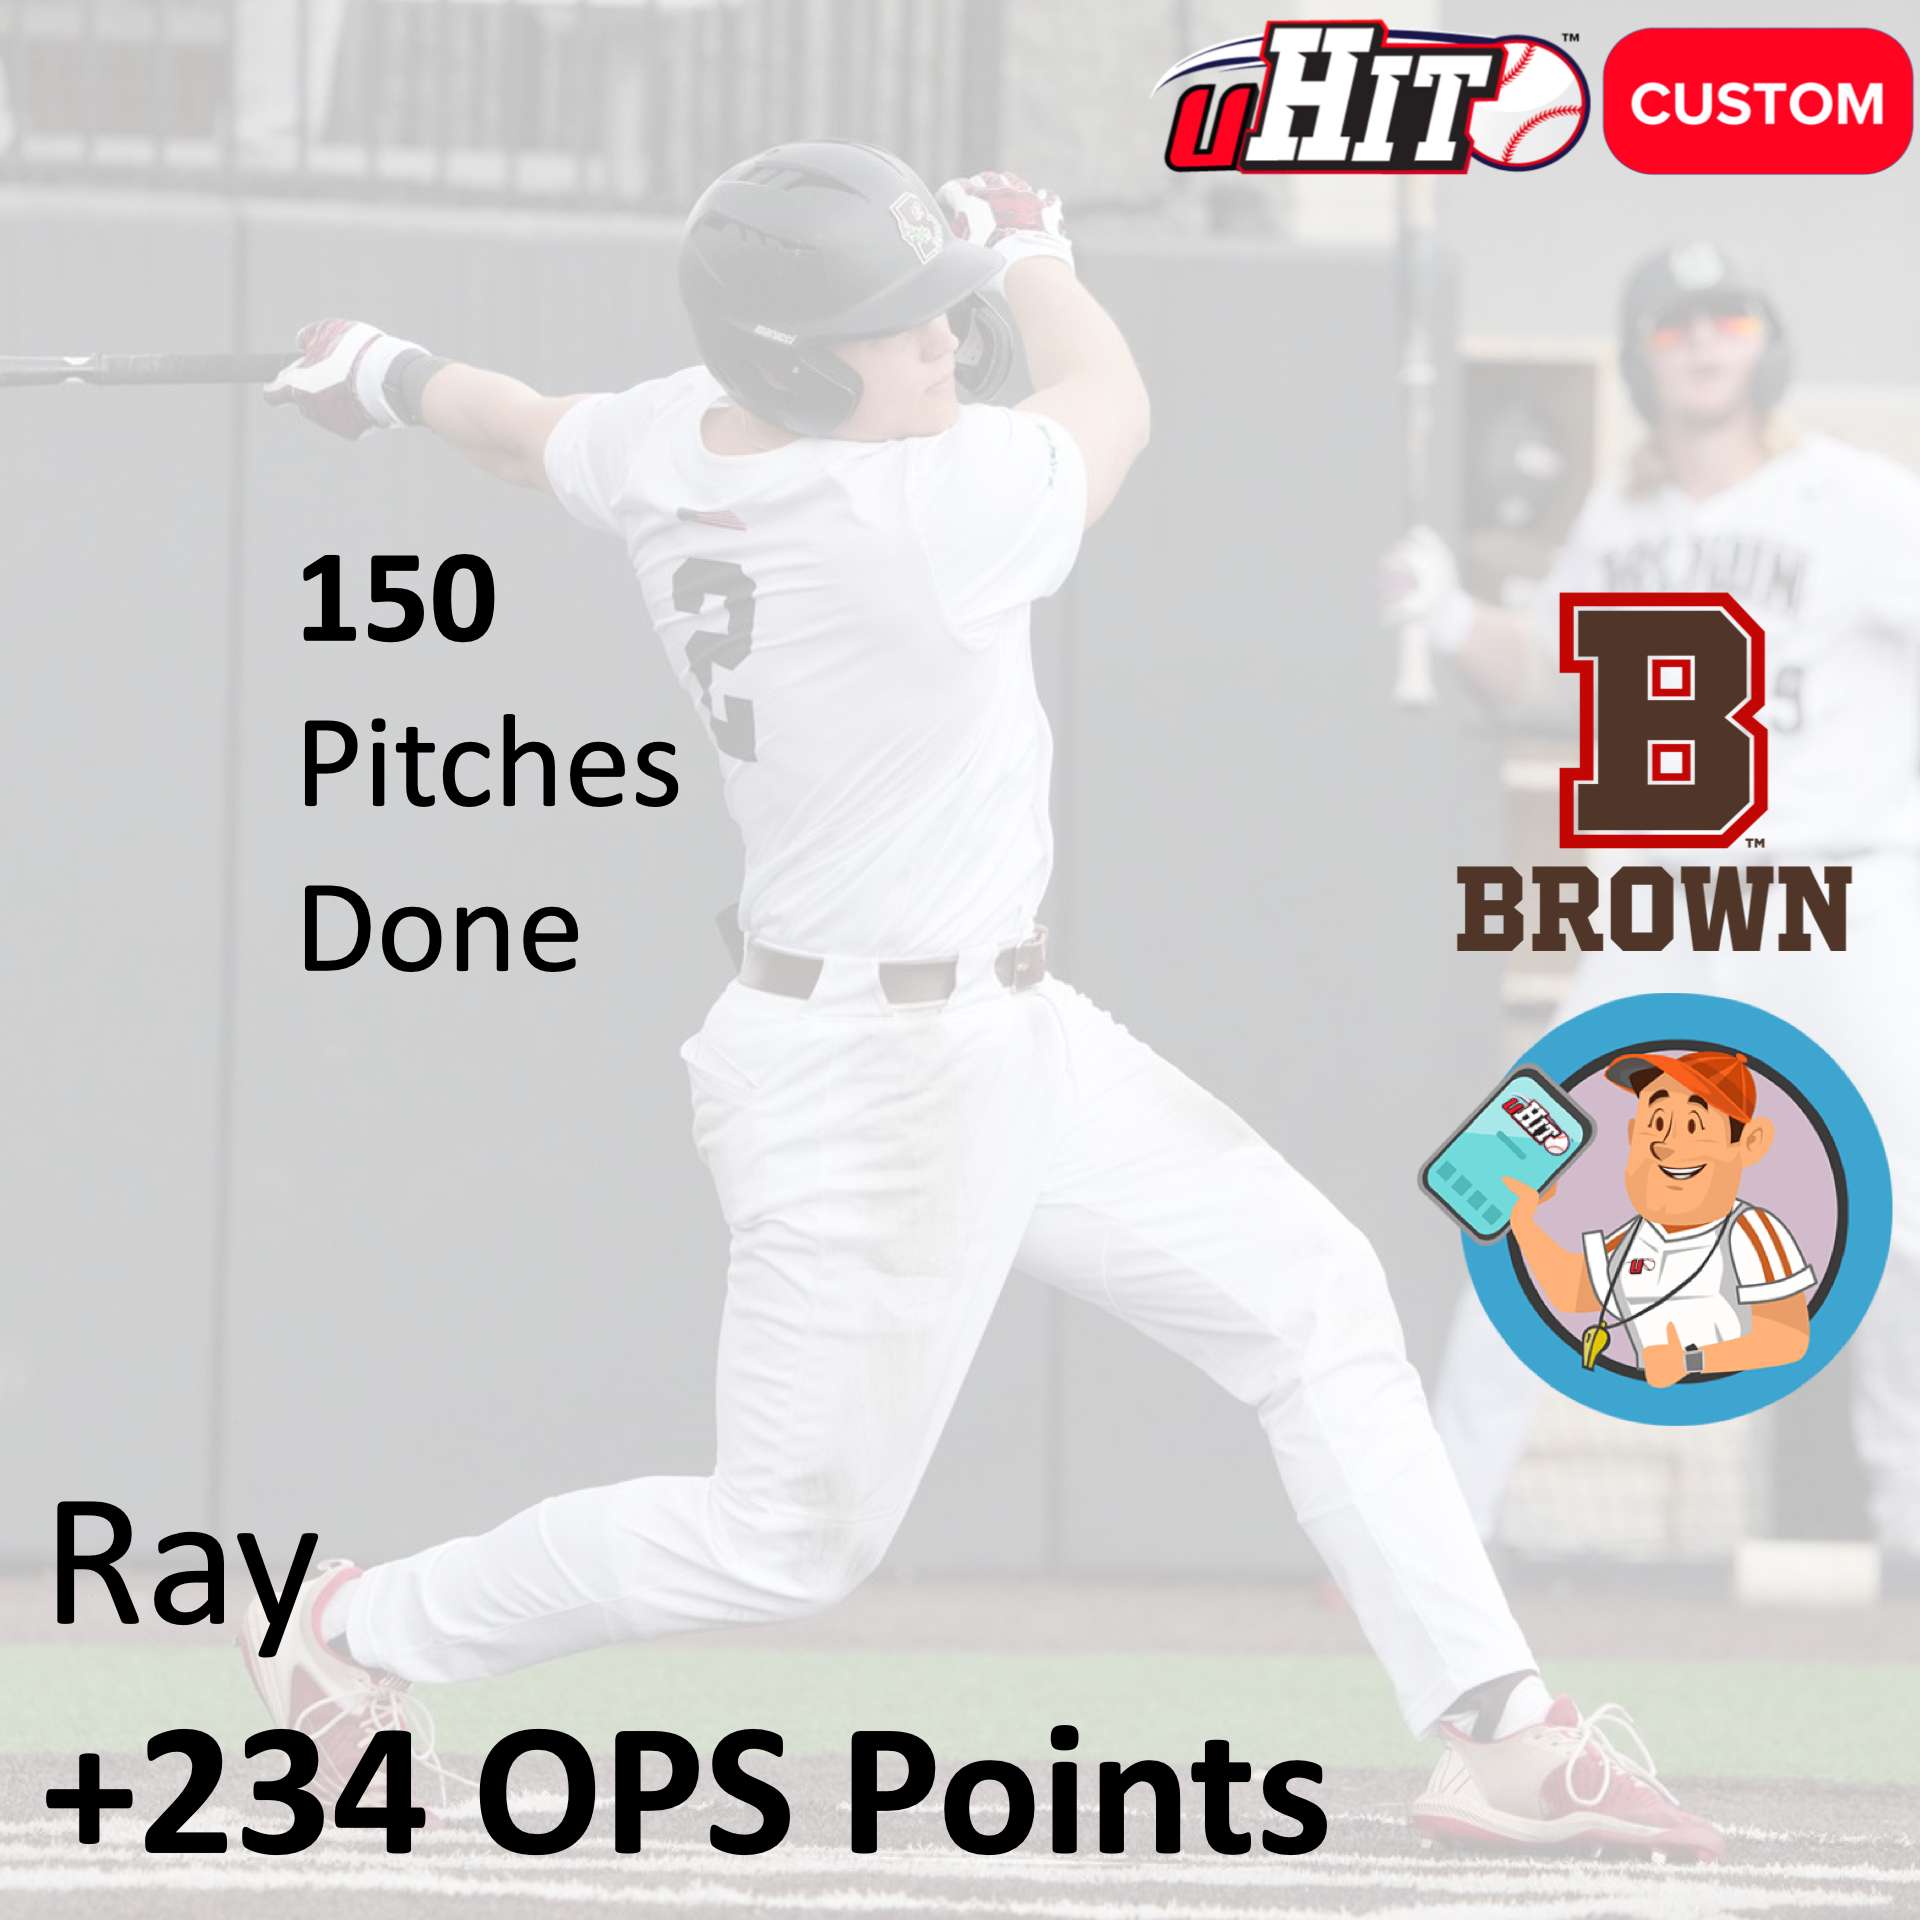
Below, we provide details on two players that particularly shined in 2022. You can see on each graphic how many pitches of uHIT Custom Training (to learn more, click here) they did.
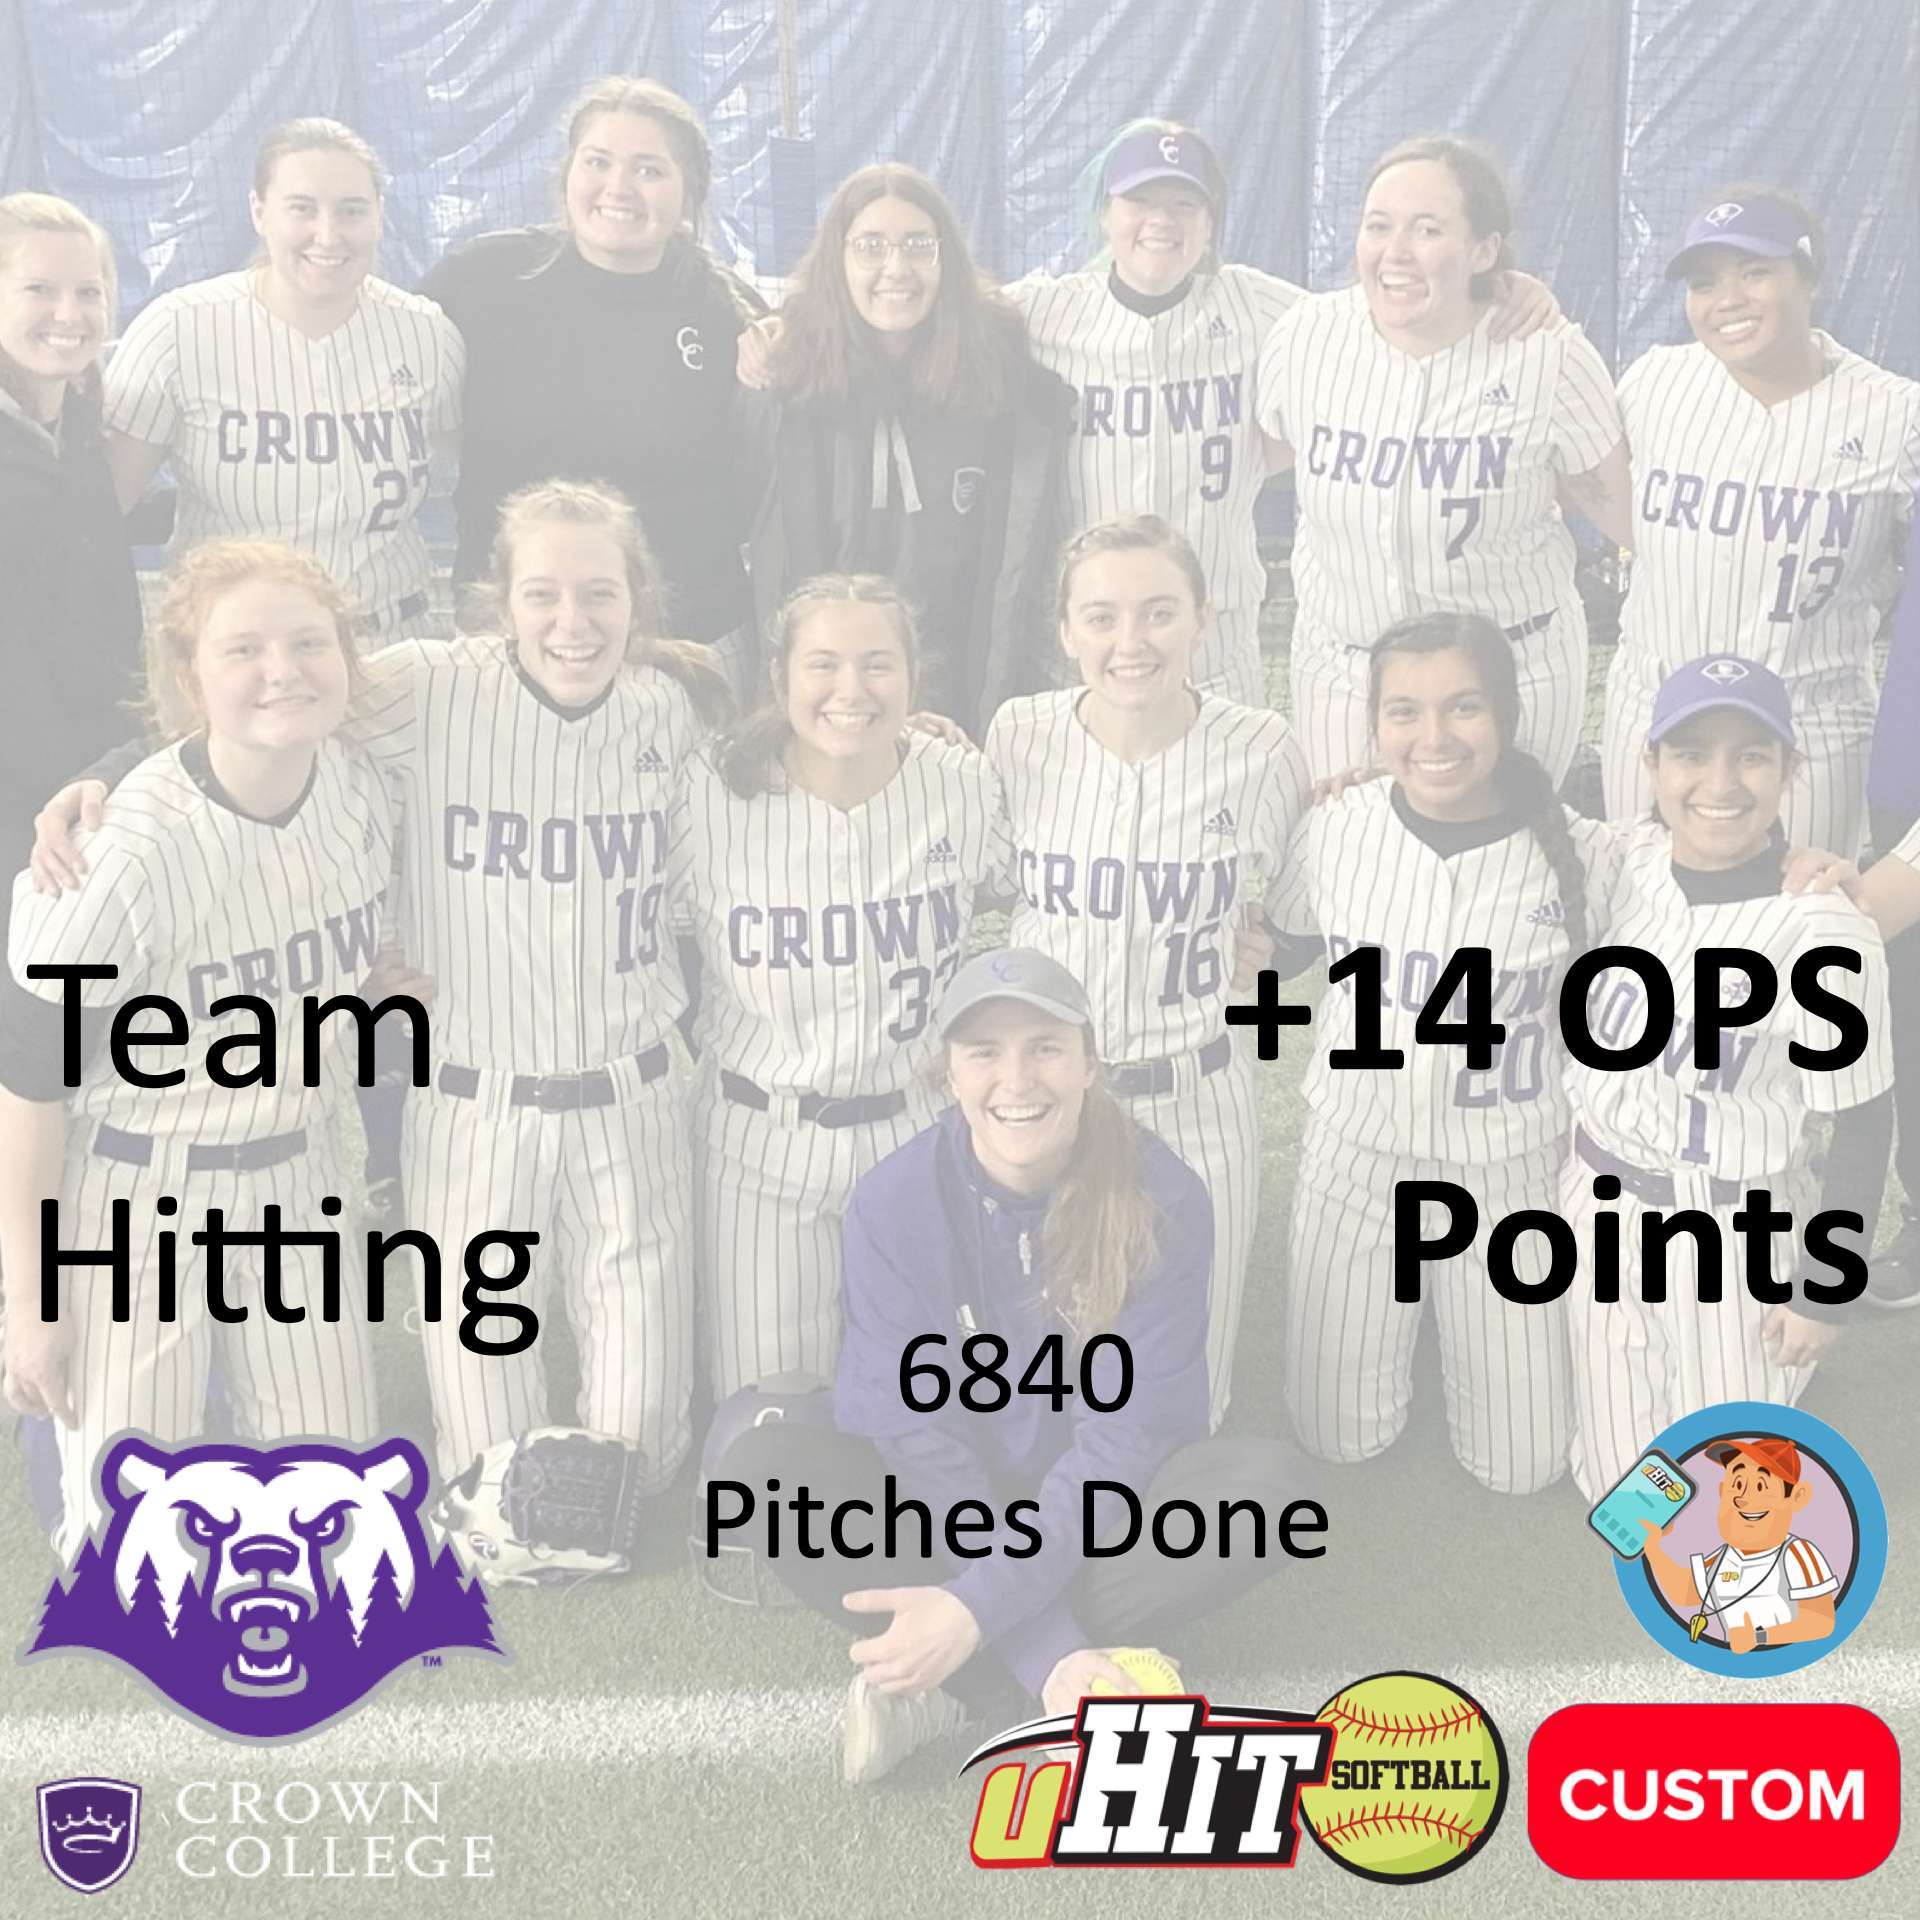
Crown College Softball | +14 OPS Points
In Spring 2021, Crown College Softball and former Hitting Coach and now Head Coach Jamie Ross took a new approach to spring training. Ross implemented uHIT Custom Training, starting with 19 hitters going through Zone and Pitch Recognition Assessments for baselines. (You can learn more about uHIT Softball Assessments from trying one here)
Just like Brown Baseball, some players stick with the program, while others fall off. But the players that stuck with the program contributed positively to their team’s hitting the following spring. Let’s use the same procedure to evaluate the team-level changes we saw.
Evaluating Team-Level Assessment
Before we look at on-field, let’s again look at what we saw in uHIT. All players did the Zone and Pitch Recognition Assessments in uHIT Softball (to learn more about Pitch Recognition Assessment analogs in baseball, click here; to learn more about Zone Recognition Assessment analog, click here). As above, we will focus on XP as a summary measurement of Pitch and Zone Recognition skills, now in uHIT Softball (click here to learn more).
Across the team, each player produced an XP Per Pitch average. Again, this value tells us how accurately AND quickly a player recognizes balls/strikes and different pitches. We get a team average XP Per Pitch by simply averaging all players’ values again from each Assessment. Using that approach, we find a team XP Per Pitch of 21.7 XP Per Pitch for Pitch Recognition, and 38.5 XP Per Pitch for Zone Recognition.
Evaluating Team-Level Training Effect
Now, we look at whether uHIT Custom Training moved the needle from this baseline. As with Brown Baseball, some players on Crown Softball did a lot of work in uHIT, while others fell off. To account for this variability like we did above, we use the “dot product” (see more here and how to implement here). We do this calculation because it’s a more accurate reflection of how all players performed as a group in training (see example of three players above for a refresher).
We can now apply that strategy to all players who did uHIT Custom Training in Pitch Recognition (14 players). Doing so, we get a team-level performance of 54 XP Per Pitch. In Zone Recognition, we saw team-level performance jump to 80 XP Per Pitch.
Recapping Assessment to Training Improvements in uHIT
Summarizing that all for you, the team began Pitch and Zone Recognition Assessments as follows:
- Pitch Recognition Assessments: 21.7 XP Per Pitch
- Zone Recognition Assessments: 38.5 XP Per Pitch
After 4-8 weeks of training, the team performed at Pitch and Zone Recognition Training as follows:
- Pitch Recognition Training: 53.7 XP Per Pitch (+147% Increase)
- Zone Recognition Training: 80.0 XP Per Pitch (+108% Increase)
Now we will look at whether this learning translated to the plate the following season.
Recapping Assessment to Training Improvements in uHIT
2020 was a shortened season, but fortunately again we had sufficient sample size to evaluate hitting performance (335 total ABs). Different from Brown Baseball, we could look at performance in 2021 just after Crown Softball used uHIT.
-
OPS in 2020 | .741
-
OPS in 2021 | .784
We can breakdown OPS into its component parts to see where the changes translated most. The 2020 OBP was .383, compared to the 2021 OBP of .372. And the 2020 SLG was .358, compared to the 2022 SLG of .412. In the case of Crown Softball, the big decisions like driving the ball (SLG effects) played out much stronger at the plate than the small decisions like taking pitches (OBP effects). And this accompanied their +108-147% increase in performance on uHIT Custom Training.
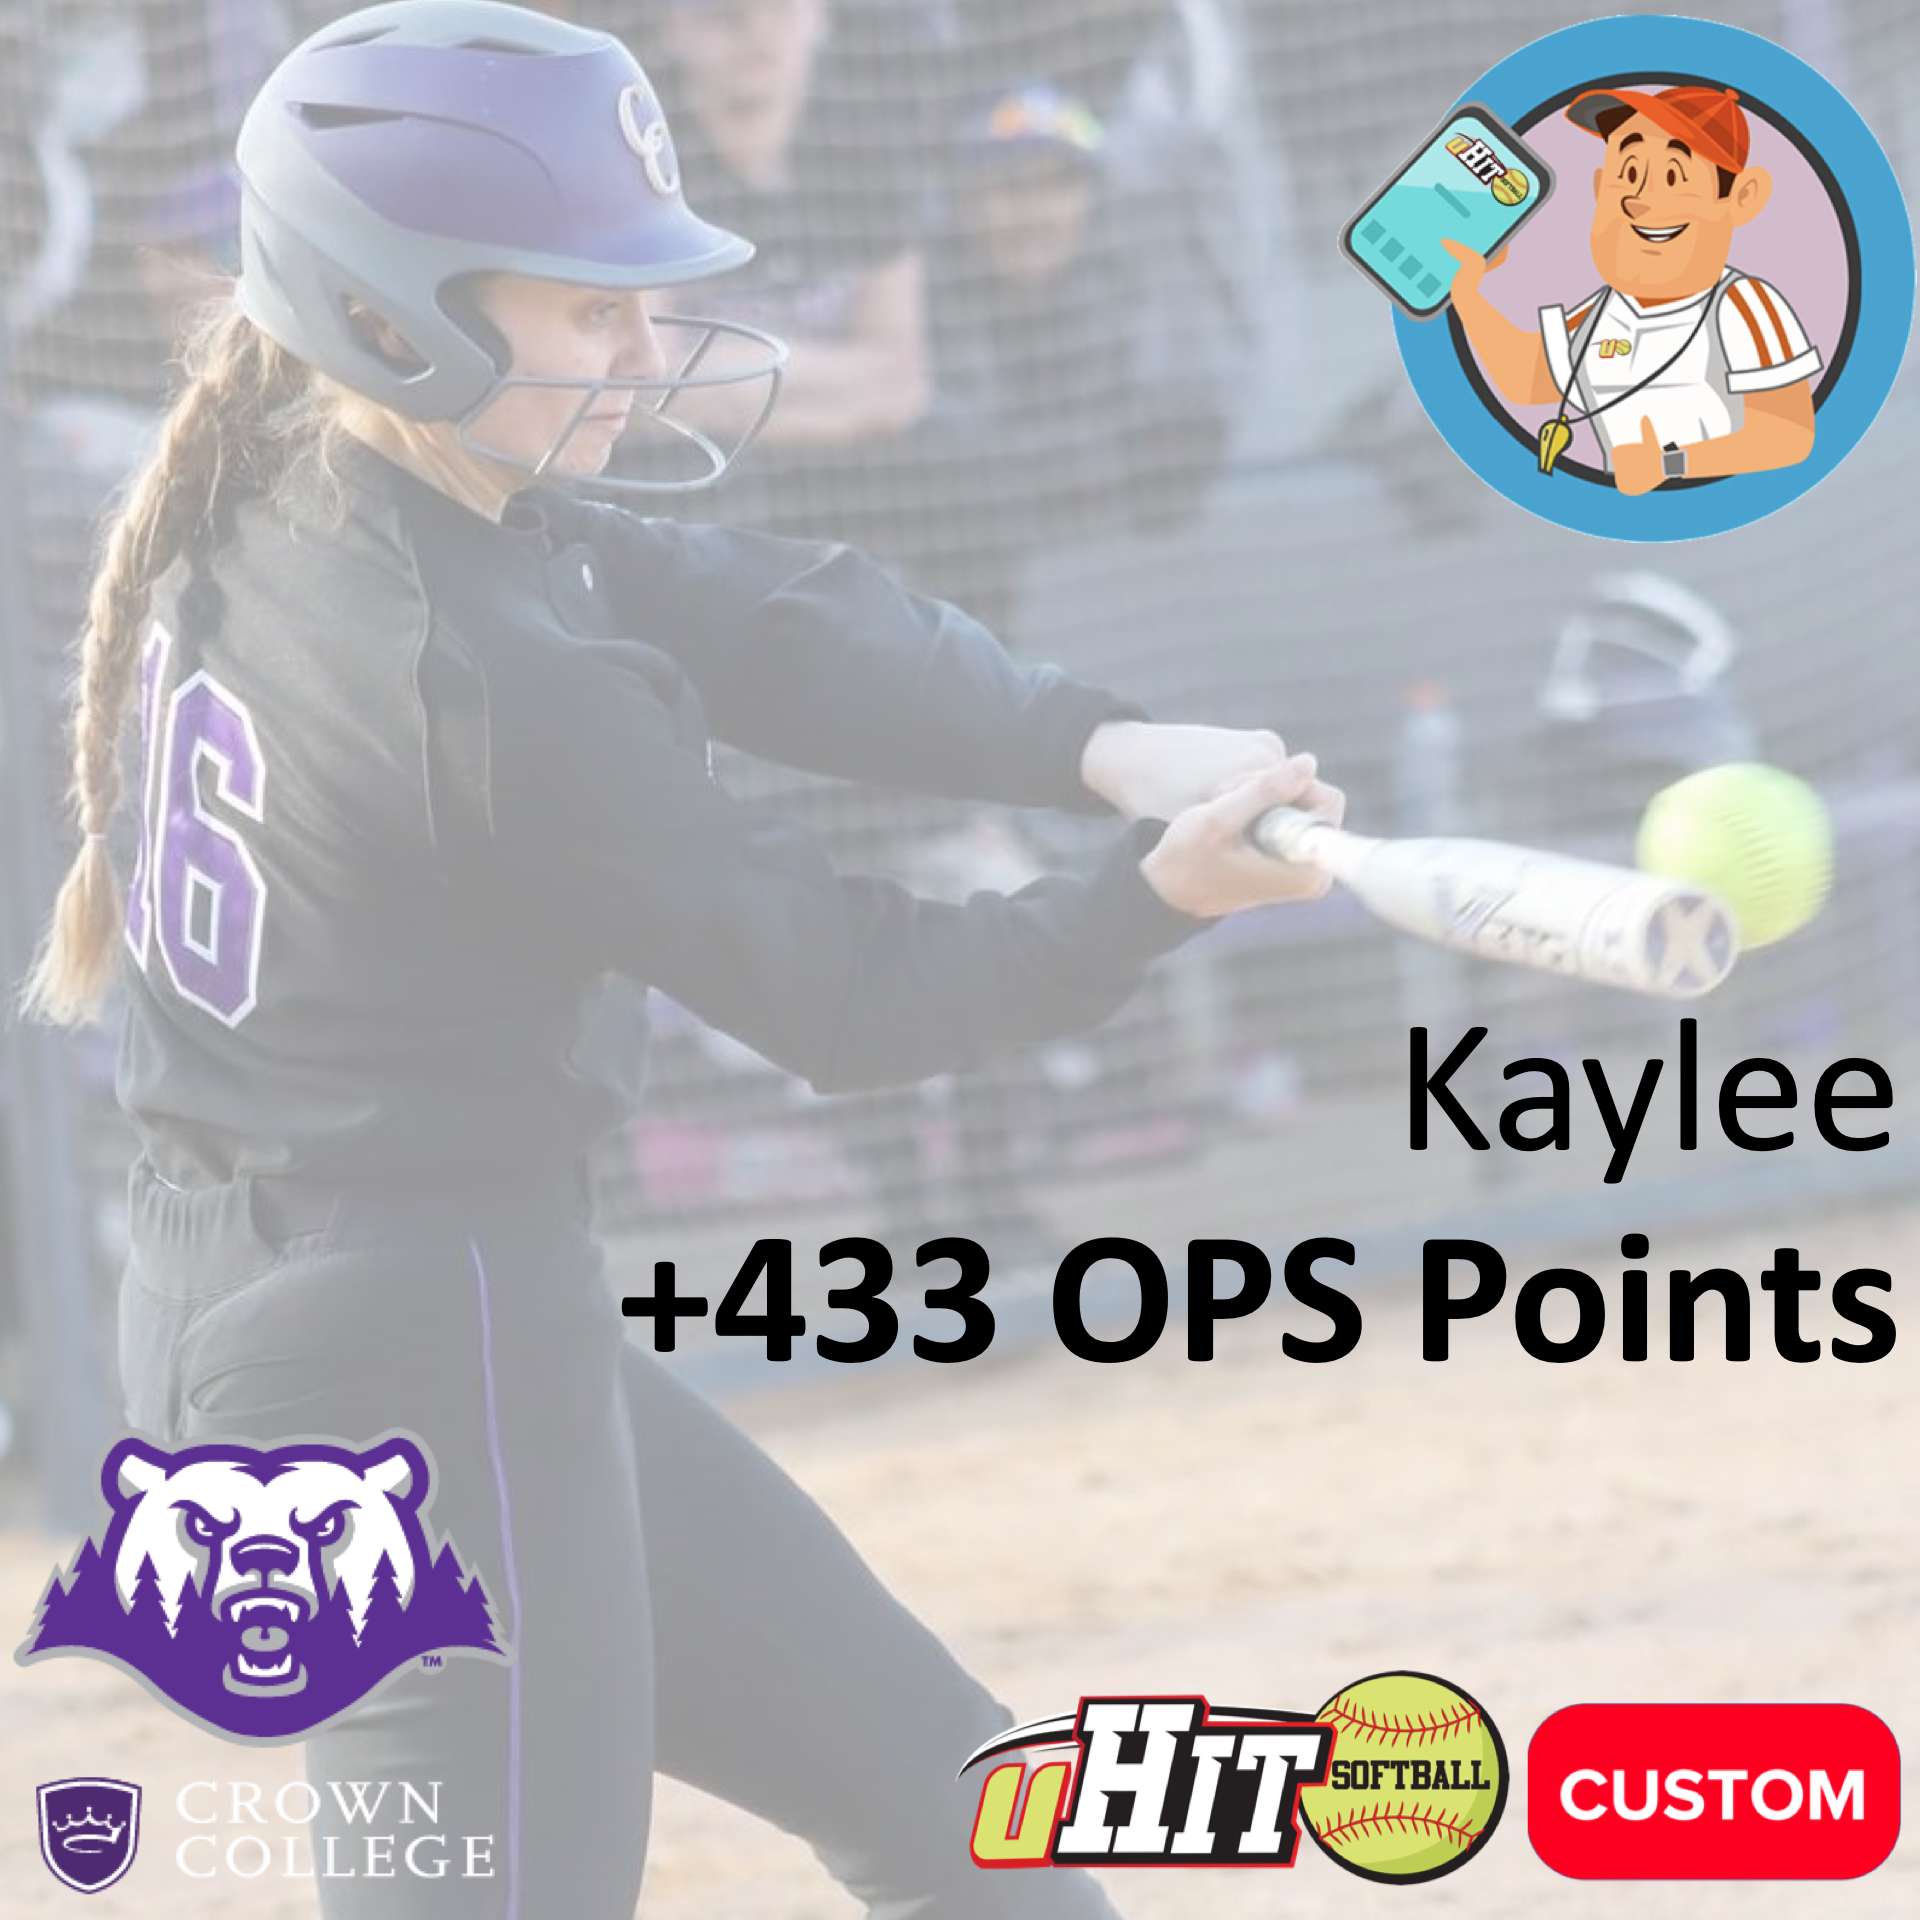
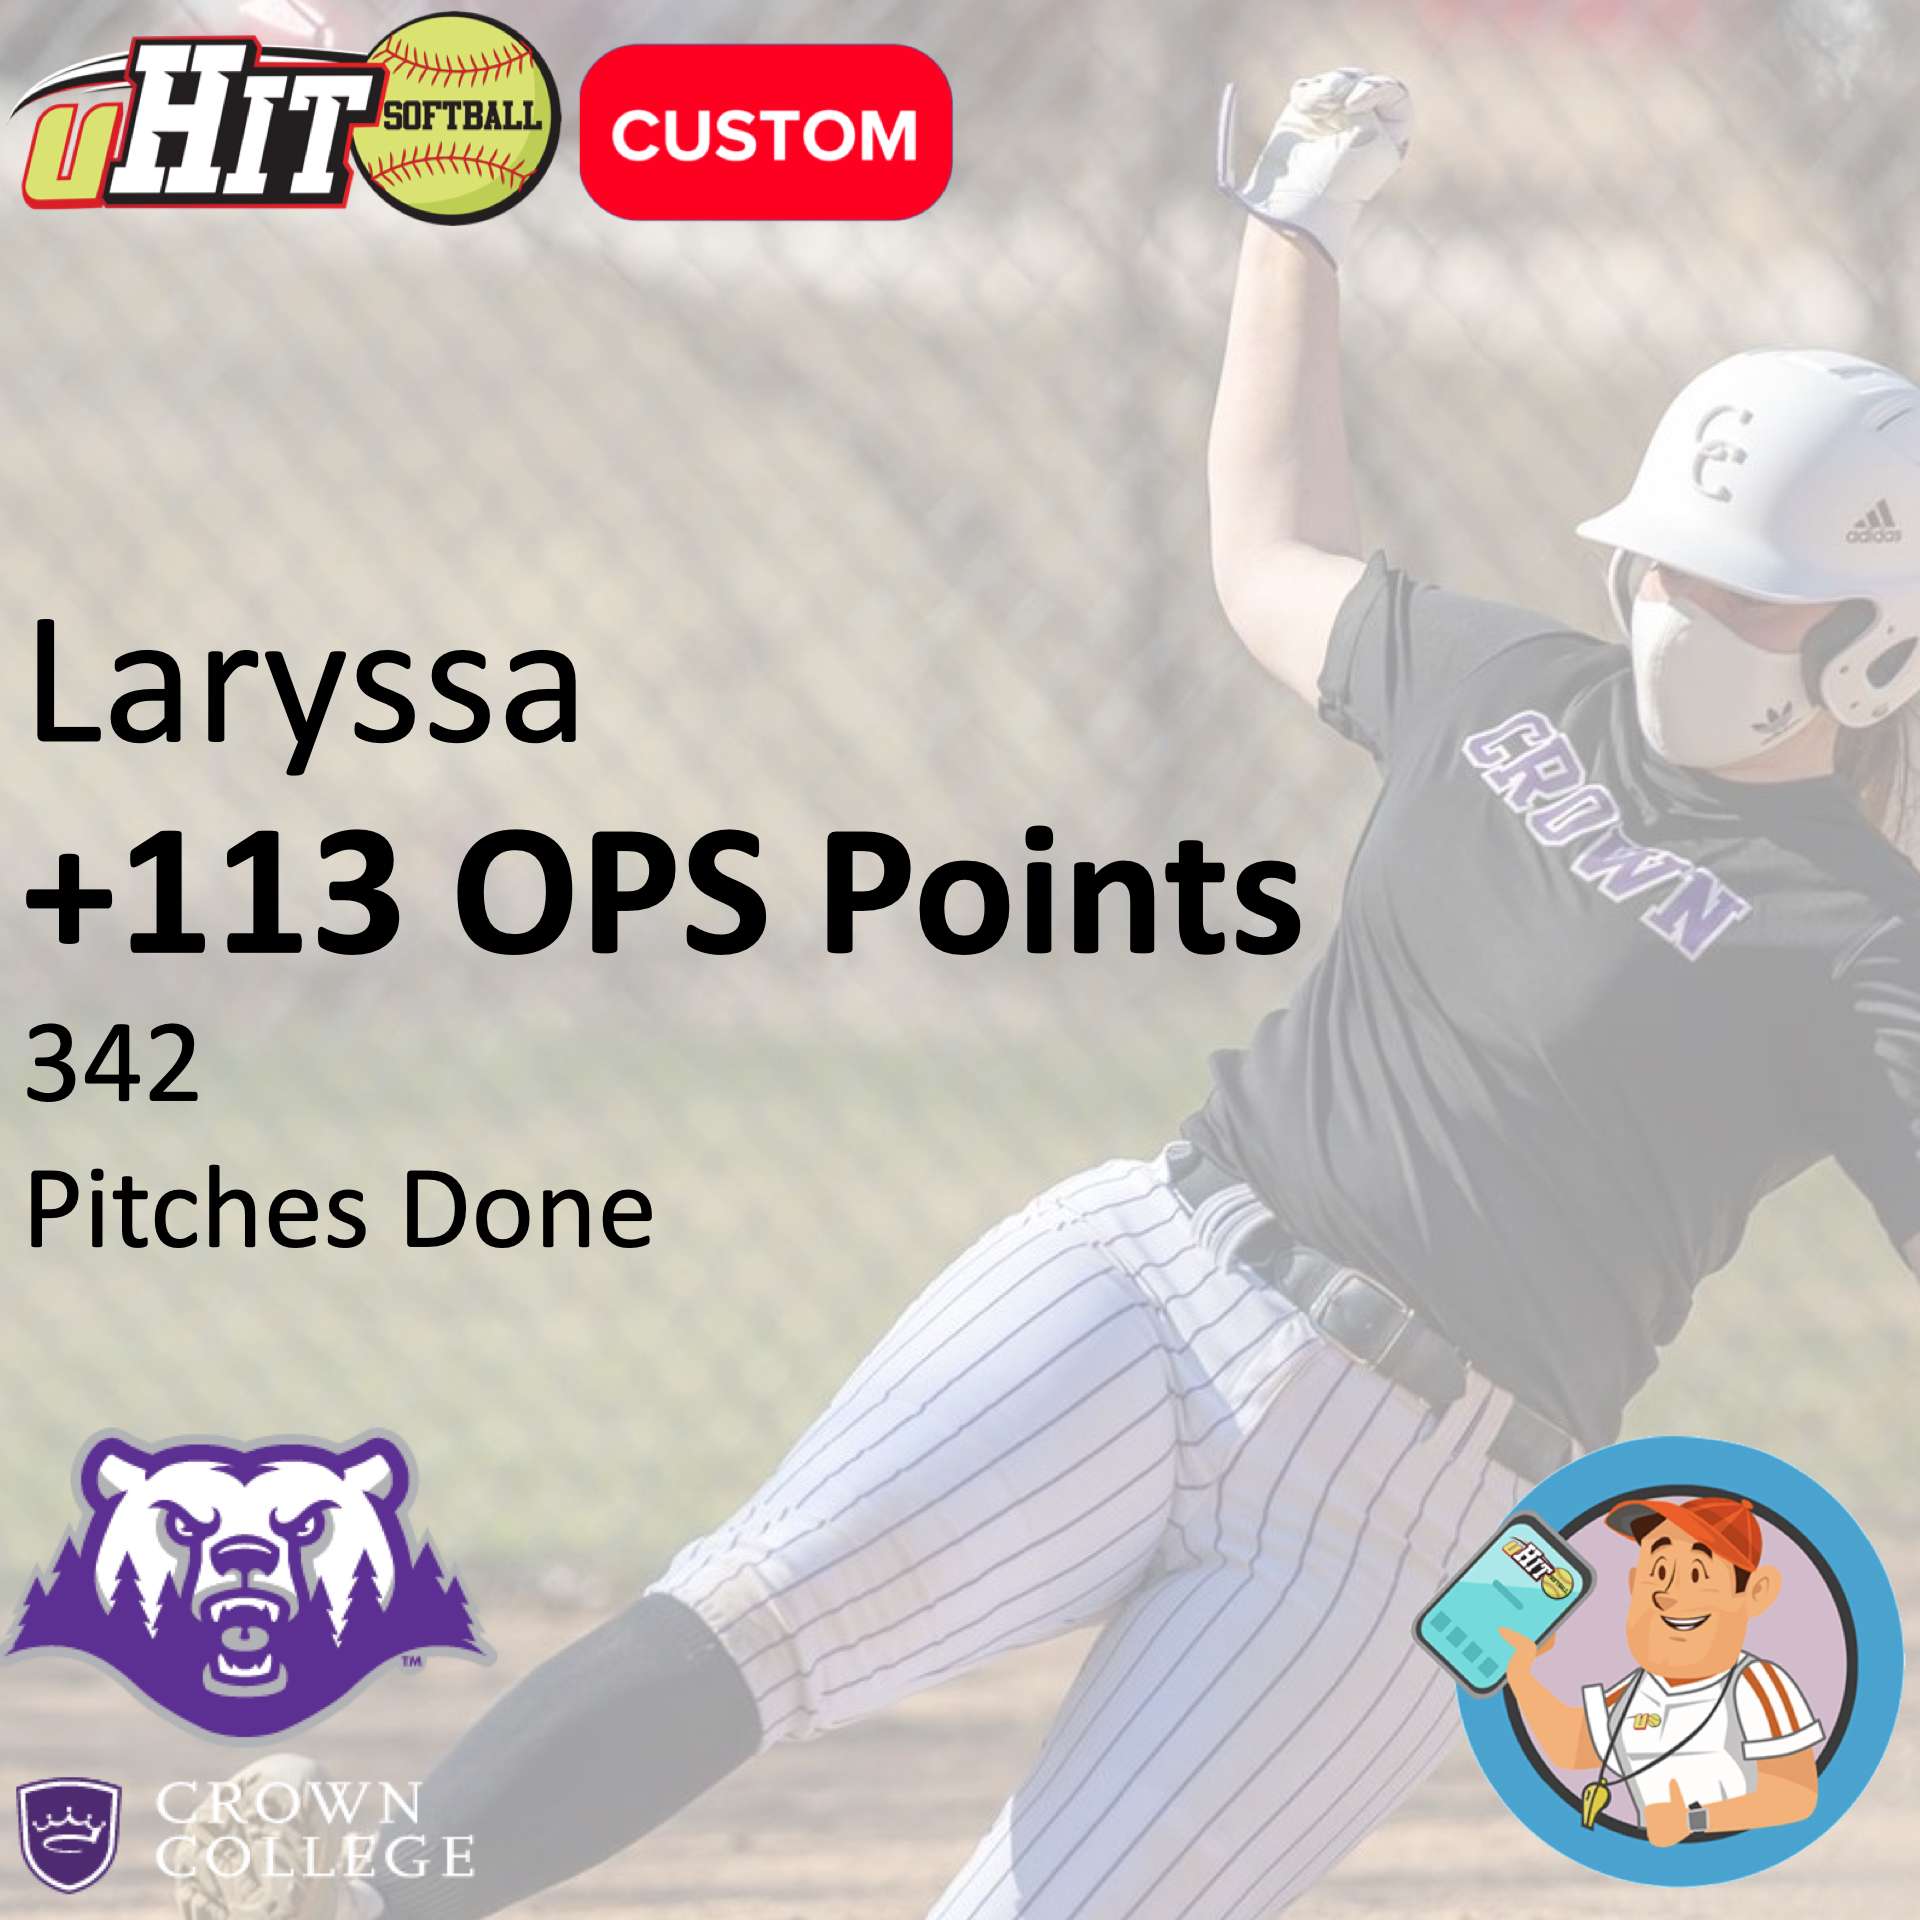
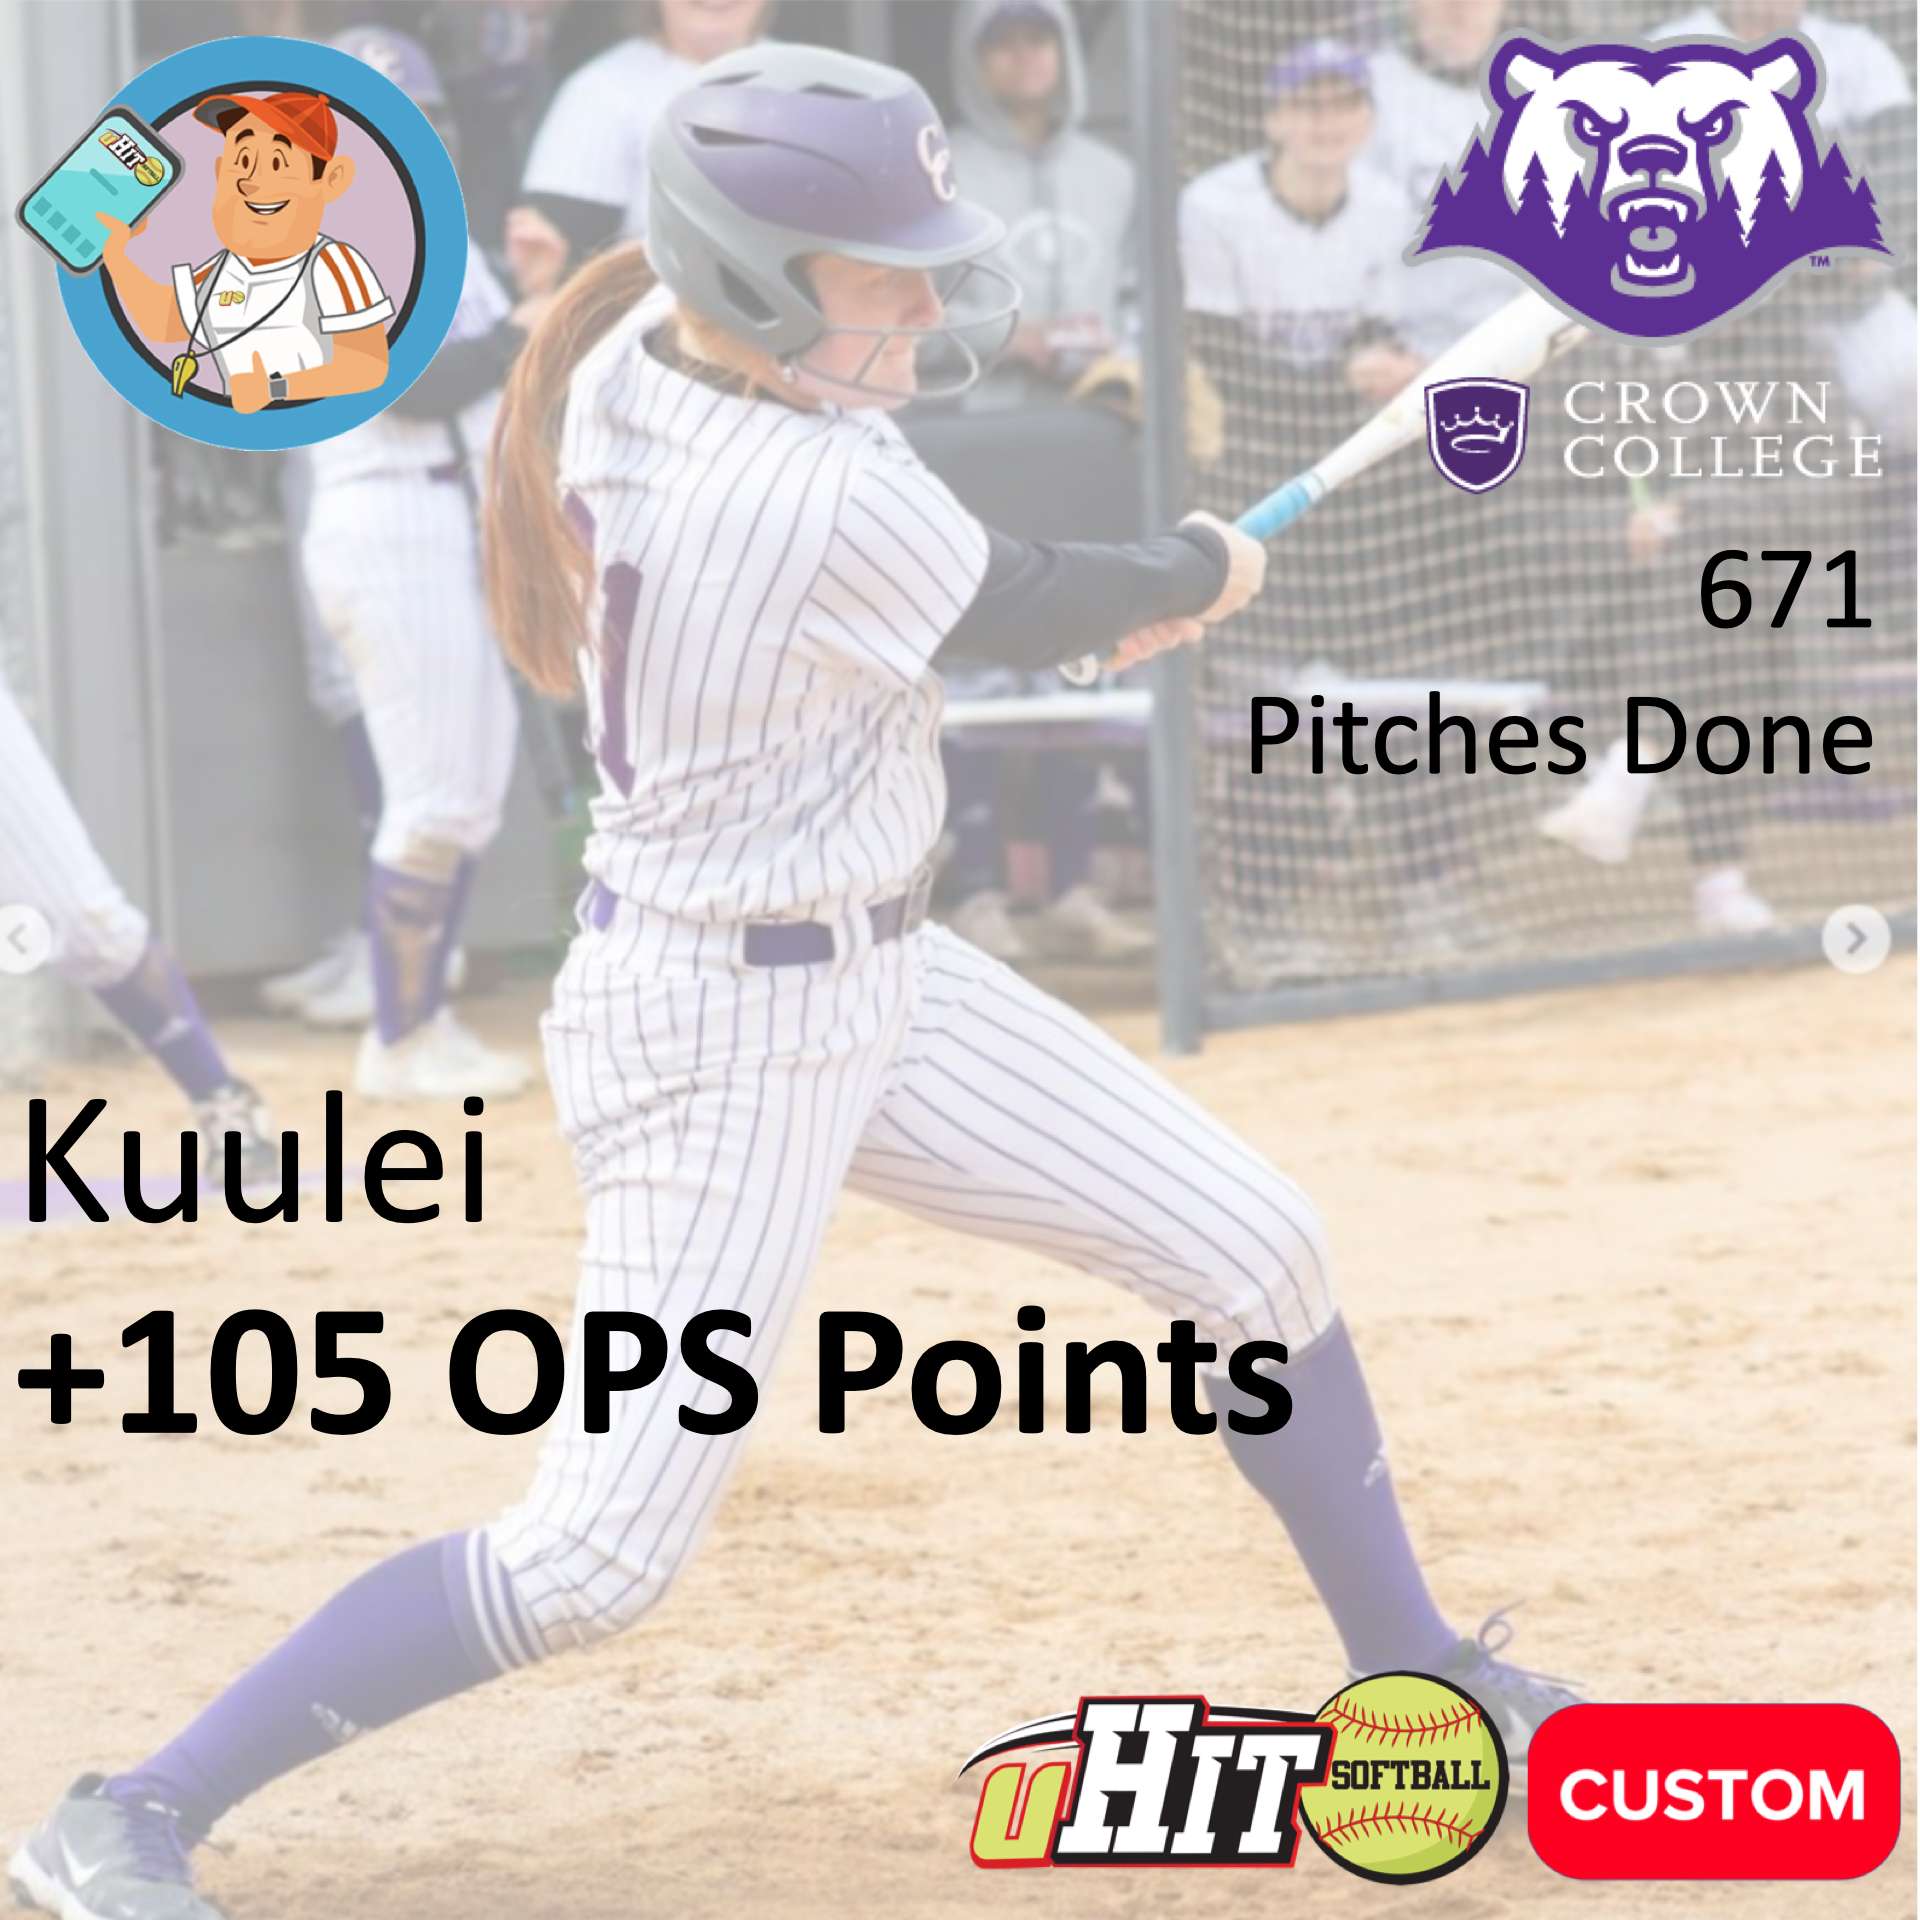
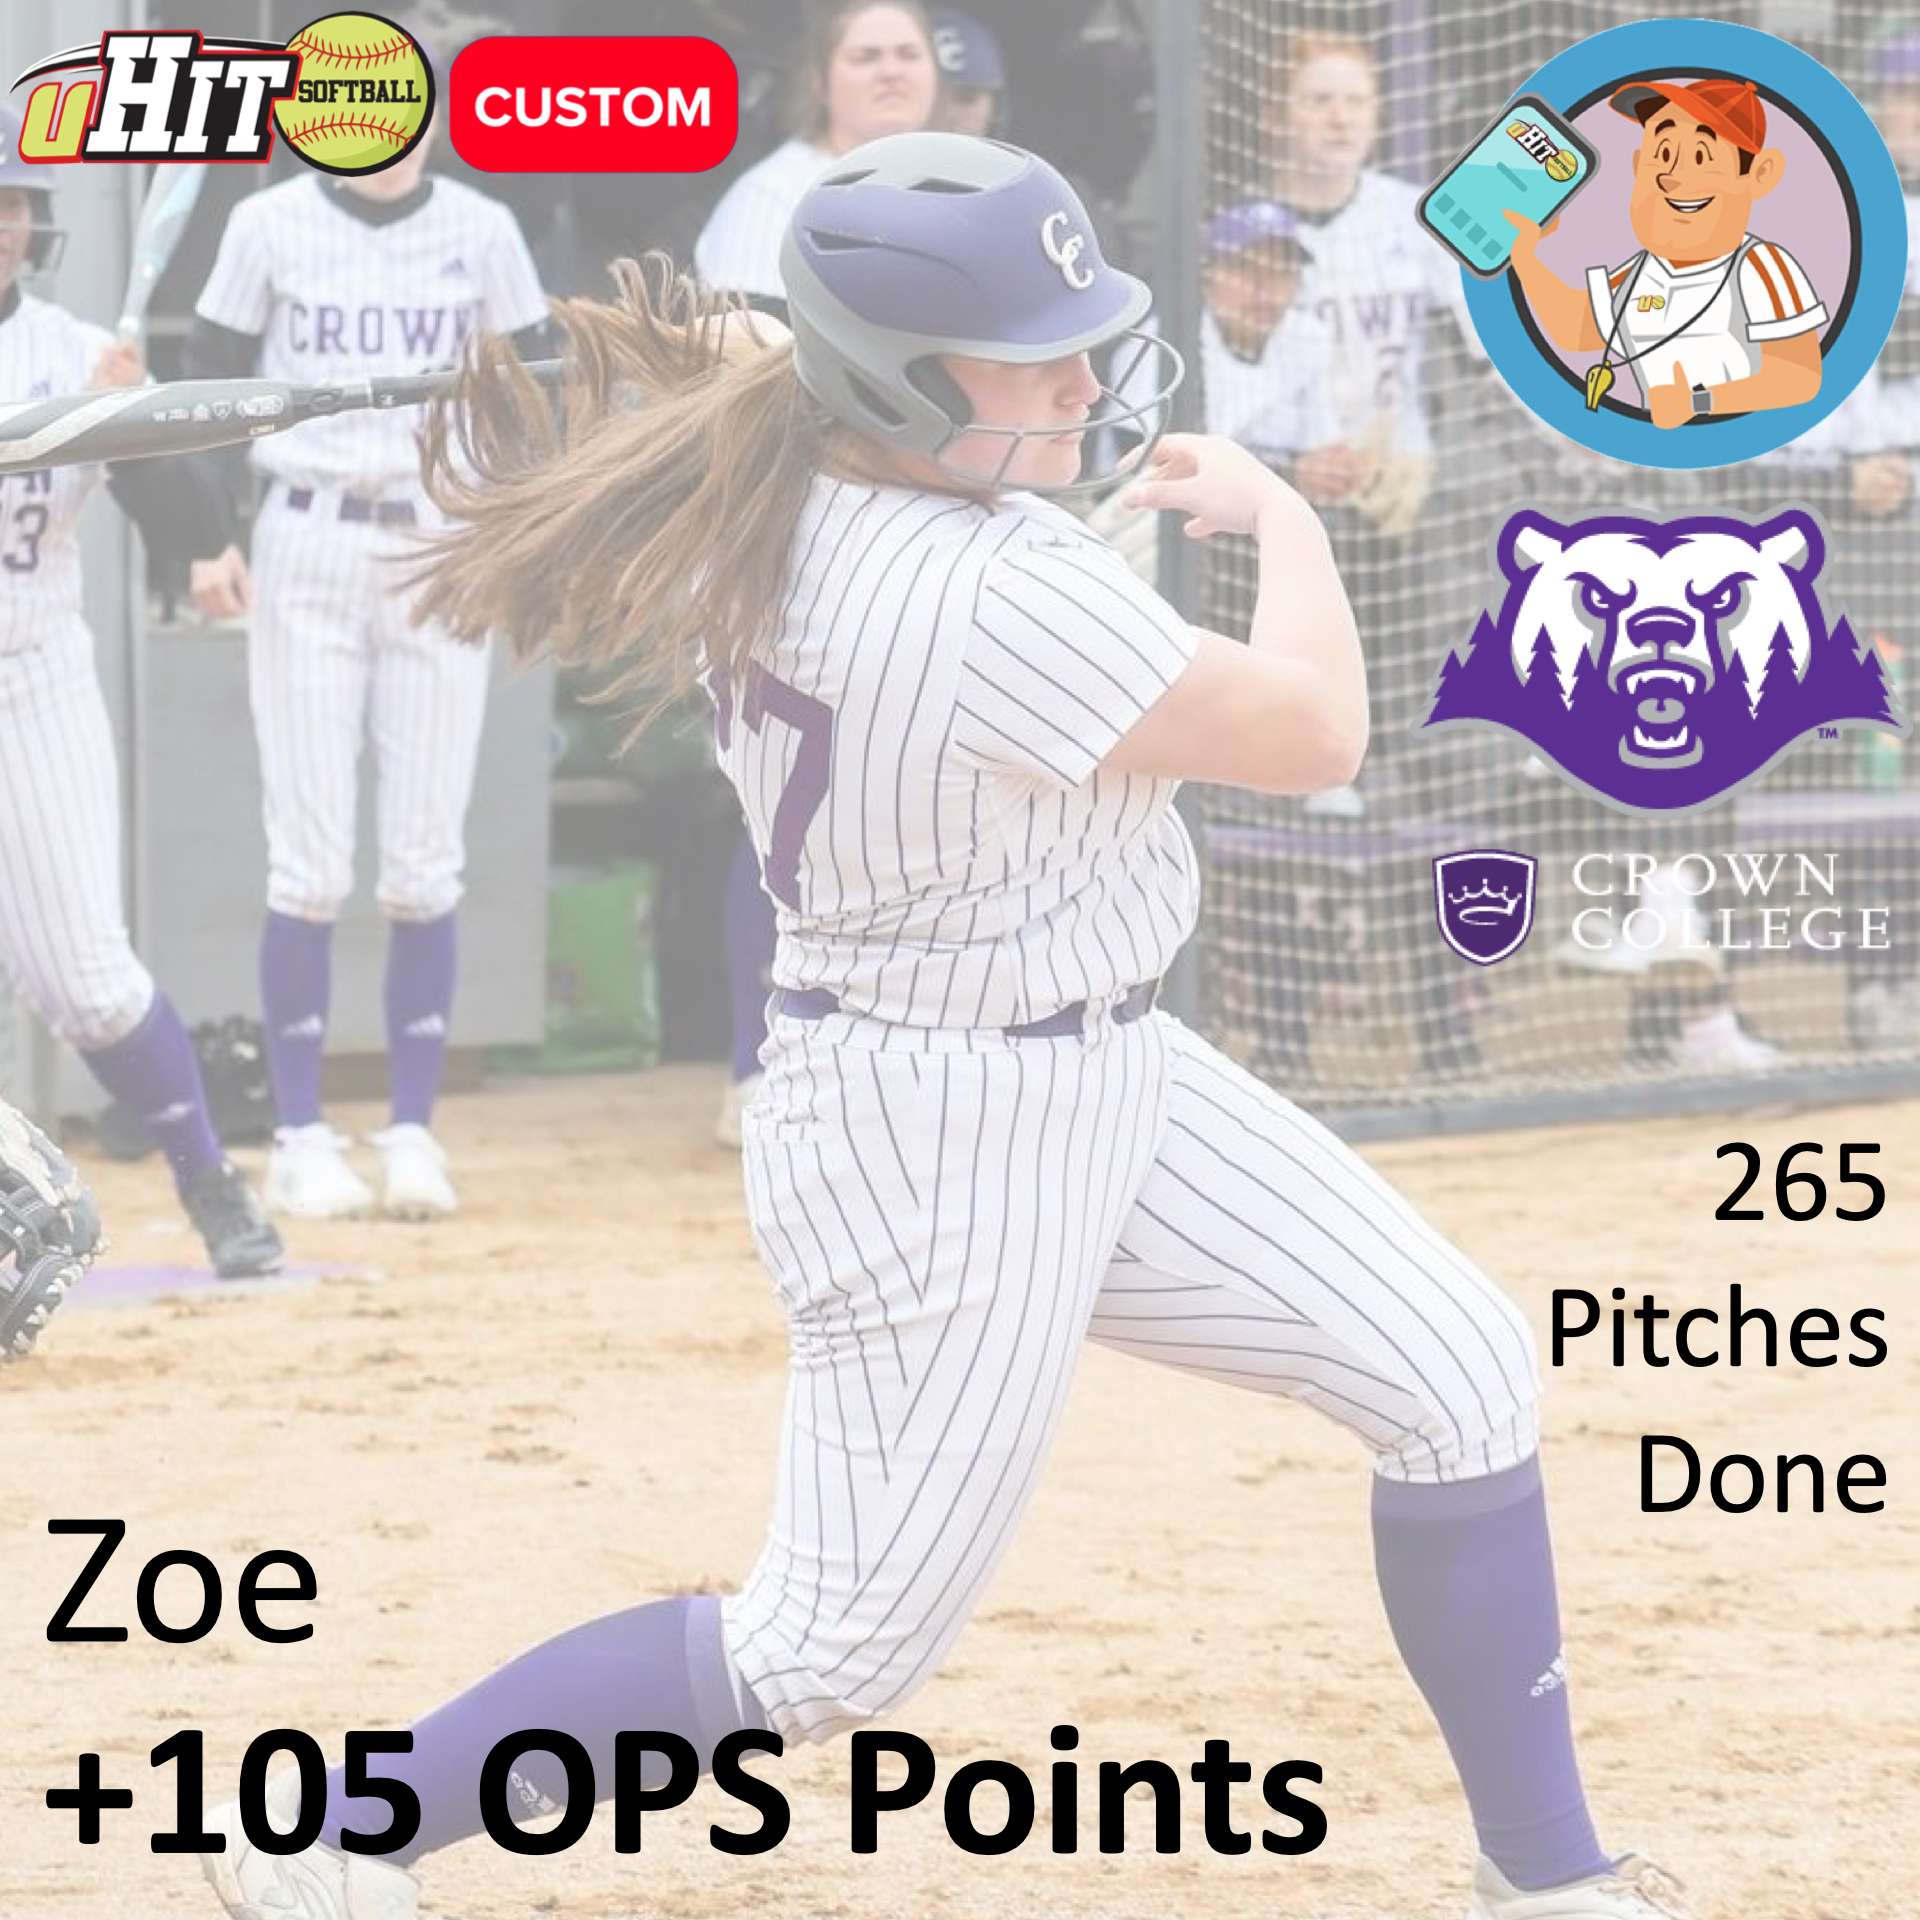
Below, we provide details on four players that particularly shined in 2021. You can see on each graphic how many pitches of uHIT Custom Training (to learn more, click here) they did.

