
Part 1 of MLB Org Assessment Case Study
57 Hitters
Across Multiple Levels
Mar 15, 2024
Part 1 of MLB Org Assessment Case Study is a look at how uHIT Assessment metrics broke down by “yes” and “no” decisions
What you need to know:
How we measured “yes-yes-no” in numbers and verified org-provided data for Part 2 analysis
Part 1 and Part 2 Overview
Part 1 of MLB org assessment case study tells you how much information about a hitter’s approach you can get from the 15-min uHIT Assessment. The assessments in zone and pitch recognition were given to all hitters during the 2016 season over one month. We also look at how we verified data provided by our org client for further analysis in Part 2.
A Note on Names and Time Per Player (Part 1)
In Part 1 of MLB org assessment case study, we will describe info we had upfront on hitters’ identities. The 57 hitters who did the uHIT Assessment were all unknown to us. All we know is that they were selected from multiple levels of our MLB org client. As a result, any of the hitters could have been from DSL, AZL, Low A, High A, AA, AAA, or even the MLB club. All we knew about their on-field performance came from process and outcome metrics collected during the rest of 2016. Some examples of these metrics are Out-of-Zone Take Rate or Ball Rate.
What the uHIT Assessment Showed Us About 57 Org Hitters (Part 1)
The Pitch Recognition and Zone Recognition components of the uHIT Assessment summarize a hitter’s skills in this areas. Here, in Part 1, we examine the average results across all hitters to see what biases they have in their hitting approach. Do they prioritize a “yes” or a “no” decision on average? We also examine trends to see which of the two portions of the assessment (Pitch or Zone skills) has a better chance of reliably relating to what a hitter does on-field.
Verifying The Org’s Provided Data (Part 1)
We wrap up Part 1 by delving into the data provided by the MLB org. Is it internally consistent? Are metric definitions clear and do they make sense as a whole? It is common today when working with an MLB to verify impact with on-field performance data. In this case, we were provided with anonymized process metrics (derived from Trackman Baseball and manual input). We had no way to verify this data with publicly available data because the hitters’ identities were hidden. But we will describe how we decided which metrics were verified, and which possibly errant.
How uHIT Assessment Tracked On-Field Results (Part 2)
To kick off Part 2, we will summarize how both the Pitch Recognition and Zone Recognition components of the uHIT Assessment summarized each hitters’ skills. From there, we will show how these metrics tracked with season-long hitting metrics of each of the anonymous hitters. We will see in Part 2 of MLB org assessment case study that the results are noisy. Remember, this is a 15-minute assessment of hitting approach compared to a full season of on-field hitting performance. But the trends are clear and we will walk you through them, particularly focusing on the pitch selection aspects of these hitters.
Noise Factors: 15-Minute Assessment, Anonymous Season Results and Pitch Recognition Difficulties (Part 2)
To close out Part 2 of MLB org assessment case study, we will detail some of the factors that make the uHIT Assessment incomplete. Why is that important? Since 2016 when this case study occurred, we have learned that the uHIT Assessment is only a starting point for improving hitting approach. We will talk about how each of these hitters’ 15-minute assessments could have been a jumping off point to address the problems we saw back then. In this section, we will also address the downsides of the hitters’ identities being hidden from us. Lastly, we will comment on the difficulty of the old Zone Recognition portion of the uHIT Assessment. We will then highlight the changes made to it so we get a better measurement of this skill.
A Note on Names and Time Per Player
57 Hitters, 15 minutes Each
Before this set of hitters, the first hitters we analyzed for this org did a version of the uHIT Assessment that includes a direct brain measurement (see more below with Marcus Stroman’s younger brother, Jayden; contact here for more info). Each of these assessments took much longer to set up and run. This is because we need many more examples of a hitter tracking and deciding on a pitch when analyzing his/her brain data than when done on a mobile device.
So the Assistant GM (now GM) of this org asked for the mobile device version of the assessment, which is now the standard uHIT Assessment (see more about it here). We would not have as detailed data on each hitter for the org. But we would be able to probe almost 50% of the org’s hitters nearly at once. And this was the best tradeoff between time / money and potential outcome for the org. The 15-minute uHIT Assessment would be the best way to do that.
Anonymous Hitters
The consulting contract for this case study was arranged with the analytics / management personnel. Generally, this means a more scientific approach. But as we’ll see in Part 1 of MLB org assessment case study, there are some downsides to being too rigorous. One example of this came in the hitters’ identities being hidden from us.
In theory, hiding the hitters’ identities is a great way to remove potential bias. Maybe we would change our measurements to “coincide” better with what the hitters’ performance on-field “should” be? Maybe we would somehow use the on-field data to otherwise steer our findings? As we’ll see below though, our piece of measuring hitting performance is small. Necessarily, there is a lot of noise around trends that the uHIT data provides from just one assessment.
But there is a downside to not identifying the hitters. That happens when we seek to understand the relationship between data provided by the org and our own. This is because we then have no external source of verification for the on-field results, other than what the org says. What if there were mistakes capturing manual input data in-season though? What if the order of some metrics were purposefully jumbled to put us to the test? It would certainly be easy for the org to discount our offering if we claimed to find a relationship with data they knew to be bogus. So we will describe how we chose which metrics provided by the org were real and which were potentially errant. This is an important element below in the rest of part 1 of MLB org assessment case study.
Multiple Levels All Together
Finally, is a Zone Contact Rate the same in DSL and AAA? What about a Ball Rate, on average? There is totally different pitching between the lowest and highest levels of an MLB org. So “apples and oranges” comes to mind when trying to lump together 57 hitters across 6 levels of play, plus the MLB. This is in an org of at least 120 hitters. It’s more like a fruit salad of apples, orange, pears, berries, and so on. And we are trying to compare their measurements on the same uHIT Assessment. This is a significant source of variability in this MLB org assessment case study. Necessarily, there will be substantial sources of noise in relating on-field results to those measured in uHIT.
What the uHIT Assessment Showed Us About 57 Org Hitters
The Bias To “Yes-Yes-Yes”
Every hitting coach tells his / her hitters to think “yes, yes, yes” on each pitch. In other words, the hitter should plan on swinging at every pitch thrown, until deciding it’s not their pitch. The way this approach is summarized is to think “yes, yes, yes, no.” It’s always “yes” to a swing, until it’s “no.” And we see this bias when we examine hitters with the uHIT Assessment. The 57 hitters examined in this org demonstrated it well. For instance, in Zone Recognition, 42% of in-zone pitches were tapped, while 28% were taken.
Because of this tendency, we have increasingly seen over the years how uHIT excels as a tool to measure impulse control. Specifically, uHIT, as we’ll see with the assessment, is best suited to measuring a hitter’s “no” and how appropriately he deploys it.
The Pitch Recognition Portion
Verified Pitch Recognition Results
The Pitch Recognition portion of the uHIT Assessment gave us a good snapshot of the hitters’ ability to perform a new task like recognizing pitches on a screen. On average, we saw within this MLB org assessment case study:
- 73% Accuracy
- .516s Reaction Time (on 78mph average pitch speeds)
- 65 XP / Pitch
This group was generally more accurate (higher Accuracy) than the pro/college trend we generally see on Pitch Recognition. They also saw more evidence (longer Reaction Time) before making their decisions (see here for more). Still, a 73% Accuracy told us that the hitters understood the task in the Pitch Recognition portion of the assessment. Conversely, if the average were 50% then this would tell us all hitters were guessing pitch types (see below about the 50/50 split of pitches). But because we are way over that mark here, we know we had a sound measurement of this group’s abilities in Pitch Recognition.
The Bias To “Yes” in Seeing Pitch Types
Now, let’s look more into the breakdown of the decisions within these averages. The Pitch Recognition portion of the uHIT Assessment also showed how the “yes-yes-yes-no” bias is ingrained in hitters’ approach:
- 52% of pitches correctly identified as “yes”
- 22% of pitches correctly identified as “no”
- 20% of pitches mistakenly identified as “yes” (they were in fact “no”)
- 6% of pitches mistakenly identified as “no” (they were in fact “yes”)
Two things jump out from these average results within the MLB org assessment case study. First, 72% of pitches were “yes” decisions (52% and 20%) regardless of the pitch thrown. But the uHIT Assessment purposefully has an approximately 50/50 split between “yes” and “no” pitches. We do this to get as fair of an evaluation of a hitter’s ability to decide “yes” or “no” on a pitch at the plate. Because the bias towards “yes” is over 20% above this 50/50 split, we see firstly the strong bias towards “yes” discussed above.
Second, we see the bias towards “yes” even when mistaken. Within the 28% total of “no” decisions, we see a paltry 6% mistakenly identified as “no” pitches. This lop-sided imbalance between mistakenly identified pitches (20% vs. 6%) shows us again the tendency towards “yes” with all hitters.
The Zone Recognition Portion
The Early Version of Zone Recognition
Before standardizing the Zone Recognition portion in 2020, the uHIT Assessment measured in-zone vs. out-zone skills with real MLB pitchers’ trajectory data. Without contextual cues like count and situation, this made the Zone Recognition portion of the assessment quite challenging. In 2016, the 57 hitters of this MLB org did the more challenging version of this portion of the assessment. (Now, the Zone Recognition is standardized to a set of pitch types and speeds from 82-90mph for pro / college hitters, about which you can read more here).
Verified (But Challenged) Zone Recognition Results
The Zone Recognition portion of the uHIT Assessment gave us a more noisy snapshot of the hitters’ ability to decide in-zone (“yes”) vs. out-of-zone (“no”) pitches on a screen. On average, we saw within this part of the MLB org assessment case study:
- 57% Accuracy
- .360s Reaction Time (on ~90mph average pitch speeds)
- 37 XP / Pitch
Because of the different form of the assessment in 2016, you will see that this average Accuracy is much lower than our current norms at pro level for zone recognition (see here for more). Because of the general 50/50 split of “yes” and “no” pitches, we see we are much closer to the 57 hitters guessing on this portion of the assessment than on the Pitch Recognition above. The Reaction Time is much faster than in Pitch Recognition, reflecting the MLB speeds (~90mph). Finally, we see another sign of the added difficulty in the XP / Pitch being much lower than in Pitch Recognition (37, compared to 65 above). This tells us that per pitch, it was nearly 50% harder to get points on a Zone Recognition pitch than on one in Pitch Recognition.
Overall, these results tell us that the (old version of) Zone Recognition Assessment will not tell us as much about a given hitter’s ability as the Pitch Recognition will. But we will verify this below when we look at the hitters’ uHIT data against what they did on-field that season.
The Bias To “Yes” in Seeing In- vs. Out-Zone
Again, let’s look more into the breakdown of the decisions within these averages. The Zone Recognition portion of the uHIT Assessment also showed how the “yes-yes-yes-no” bias is ingrained in hitters’ approach:
- 42% of pitches correctly identified as “yes”
- 15% of pitches correctly identified as “no”
- 15% of pitches mistakenly identified as “yes” (they were in fact “no”)
- 28% of pitches mistakenly identified as “no” (they were in fact “yes”)
As in the Pitch Recognition portion, the bias to “yes” captures 57% of the pitches. But that is a far cry from the 72% we saw early in Pitch Recognition. Rather, there is a more equitable breakdown between “yes” (57%) and “no” (43%) decisions, regardless of whether the pitch is in- or out-of-zone.
This tells us that the hitters were guessing more often in this portion of the assessment than actually observing evidence and then deciding on it. This is what they did more often in Pitch Recognition and that explains further the Accuracy and XP / Pitch imbalance noted above against Zone Recognition.
Verifying The Org’s Provided Data
Verifying Out-of-Zone and In-Zone Data
The in-zone / out-zone data came from Trackman’s automatic system for marking when pitches crossed the plate in the strike zone. So we did not anticipate a source of error in this data. Since the hitters were anonymous to us too, we had no external way of verifying this data other than by simple comparisons within what we were given. These were important considerations before beginning this MLB org assessment case study.
Our first test was to make sure all out-of-zone pitches added up. To do this, we added each hitter’s Out-of-Zone Take Rates and Out-of-Zone Swing Rates. If this sum account for 100% of the Out-of-Zone pitches then they should add up to 1. We verified for each of the 57 hitters that this was the case.
We did the same test for in-zone pitches, adding Zone Swing Rates and Zone Take Rates. There too, all 57 hitters’ data added up to 1. Without any other corroborating data, these simple tests gave us some degree of confidence that these metrics truly reflected the hitters’ on-field hitting in 2016.
Verifying Some Outcome Data While Questioning Some Too
We did not have as much confidence in all of the outcome data provided by the org. The outcome data is not produced by an automatic system like Trackman. Rather, balls / strikes are noted manually and consequently subject to human error. Also, we learned during the development of uCALL for Umpires (see more here) that umpires’ ball/strike calls are highly dependent on game factors such as batter position, catcher framing and situation. As a result, a pitch in-zone is not always called a strike. And a pitch out-of-zone is not always called a ball.
So we would verify the outcome data in two stages. First, we would do the simple test that the ball rate (B) and strike rate (S) for each of the 57 hitters sum to 100%, as we did above for in/out zone pitches. Second, we would examine the relationship between these outcome metrics and the process metrics to decide which ones best tell us about hitting performance on-field.
The first test was to add up ball rates and strike rates for each hitter. For all 57 hitters, these values summed to 1 (or 100%). The data passed the first test.
But the relationship between outcome and process metrics gave us more pause, especially on the Strike Rate data. We examined the relationship between Out-of-Zone Take Rate and Ball Rate. We then looked at the relationship between In-Zone Misses, In-Zone Takes and Out-of-Zone Misses to Strike Rate.
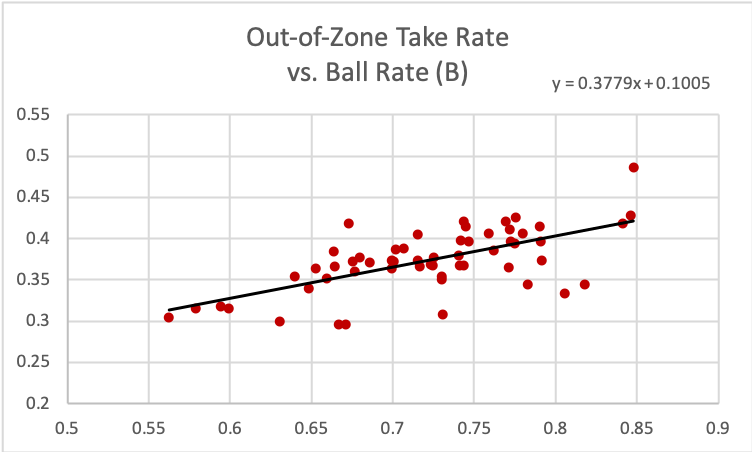
Ball Rate Makes Sense
For Ball Rate to make sense, it should have a positive trend with increasing Out-of-Zone Take Rate. And that is just what we see in the figure above. The regression line helps us estimate that, for every 10% of pitches taken out of zone, a hitter gets 3.8% more balls in-game.
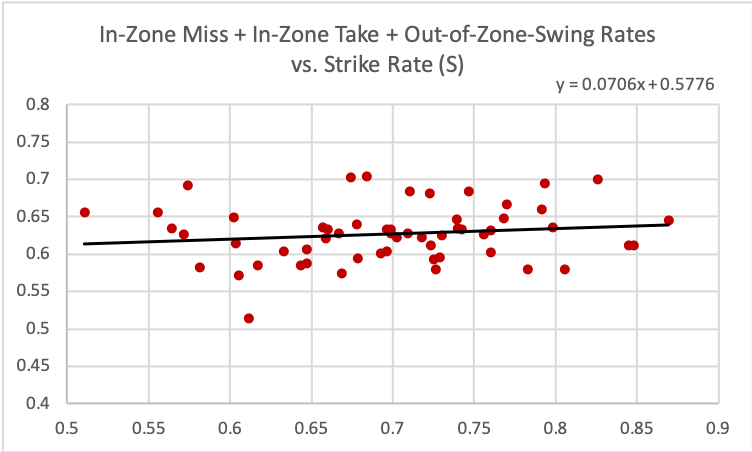
Strike Rate Is Bogus
We did a similar analysis for all the ways to get a strike (miss in-zone, take in-zone or swing out-of-zone). Confusingly, we found a near flat relationship between these process metrics and Strike Rate. We add up all three and compare below. If this graph were to be believed then every 10% increase in just one of these process metrics would increase Strike Rate by less than 1% (0.7%, to be exact). And there is just no way that is accurate. For this reason, we omitted Strike Rate from further analysis in Part 1 of MLB org assessment case study, as we look ahead now to Part 2.
Thank you for creating such valuable content. Your hard work and dedication are appreciated by so many.