uHIT Economics
uHIT Custom and Player Value
Estimating player value from OPS changes on-field
February 1, 2023
The Starting Point
How player salaries correlate to on-field hitting
In 2017, a study posted to Github analyzed player salaries and on-field hitting stats. This dataset consisted of classic on-field hitting stats. These stats include hits (H), walks (BBs) and other traditional metrics, as well as player salary. The analysis went up to the previous year, 2016, and it began in 1985.
The original dataset can be found here: http://www.seanlahman.com/baseball-archive/statistics/
The analysis of this data we will refer to in this post can be found here (along with Python commands to compute yourself): https://github.com/jacobod/Baseball-Batting-and-Salary-Analysis-In-Python/blob/master/Baseball%20Data%20Analysis%20Project%20-%20Udacity.ipynb
OPS and Standardized Salary
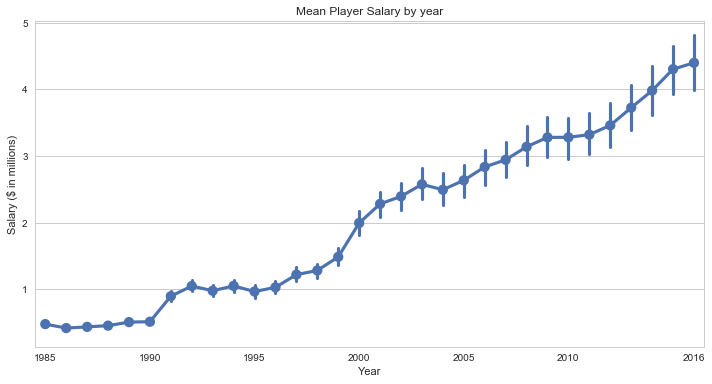
One of the conclusions from the referenced study is that player salary has increased between 1985 and 2016. In particular, during this time, the average salary has increased by nine times, going from $500K in 1985 to $4.4M in 2016. A more reliable indicator of distribution shift, the median salary has tripled, going from $500K in 1985 to $1.5M in 2016.
Because of these changes in salary each year, the author proposes a standardized player salary. Each year’s salaries are recalculated with respect to their distance to the mean salary in the standardized units of standard deviations (z-values).
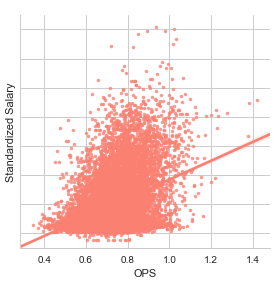
Once the salaries are standardized, the author gets the ability to aggregate all the years’ data. This is instead of just looking at one year at a time. The result is a relationship between traditional batting metrics and standardized salary. This relationship can always be translated into a given year’s salary distribution to estimate the present value of a player changing his on-field hitting performance.
We will focus on OPS following the author’s conclusion: “There are strong positive relationships between Standardized Salary and OBP, SLG, and OPS. with OPS and OBP being stronger than Slugging. Players with higher stats in these categories were more likely to have a higher salary than a lower salary.” From Output 618, it seems that every 200 OPS points amounts to approximately 0.8 standard deviations in standardized salary. We will use this estimate as we evaluate the economics of applying uHIT Training (both Custom and Gameday) for pro hitters.
Case Study #1: uHIT Gameday
In our work with pro teams, we frequently have confidentiality agreements barring us from revealing players’ identities. Here, we will follow that practice and refer to each player as “Player #1”, “Player #2”, etc. We will begin here with Player #1.
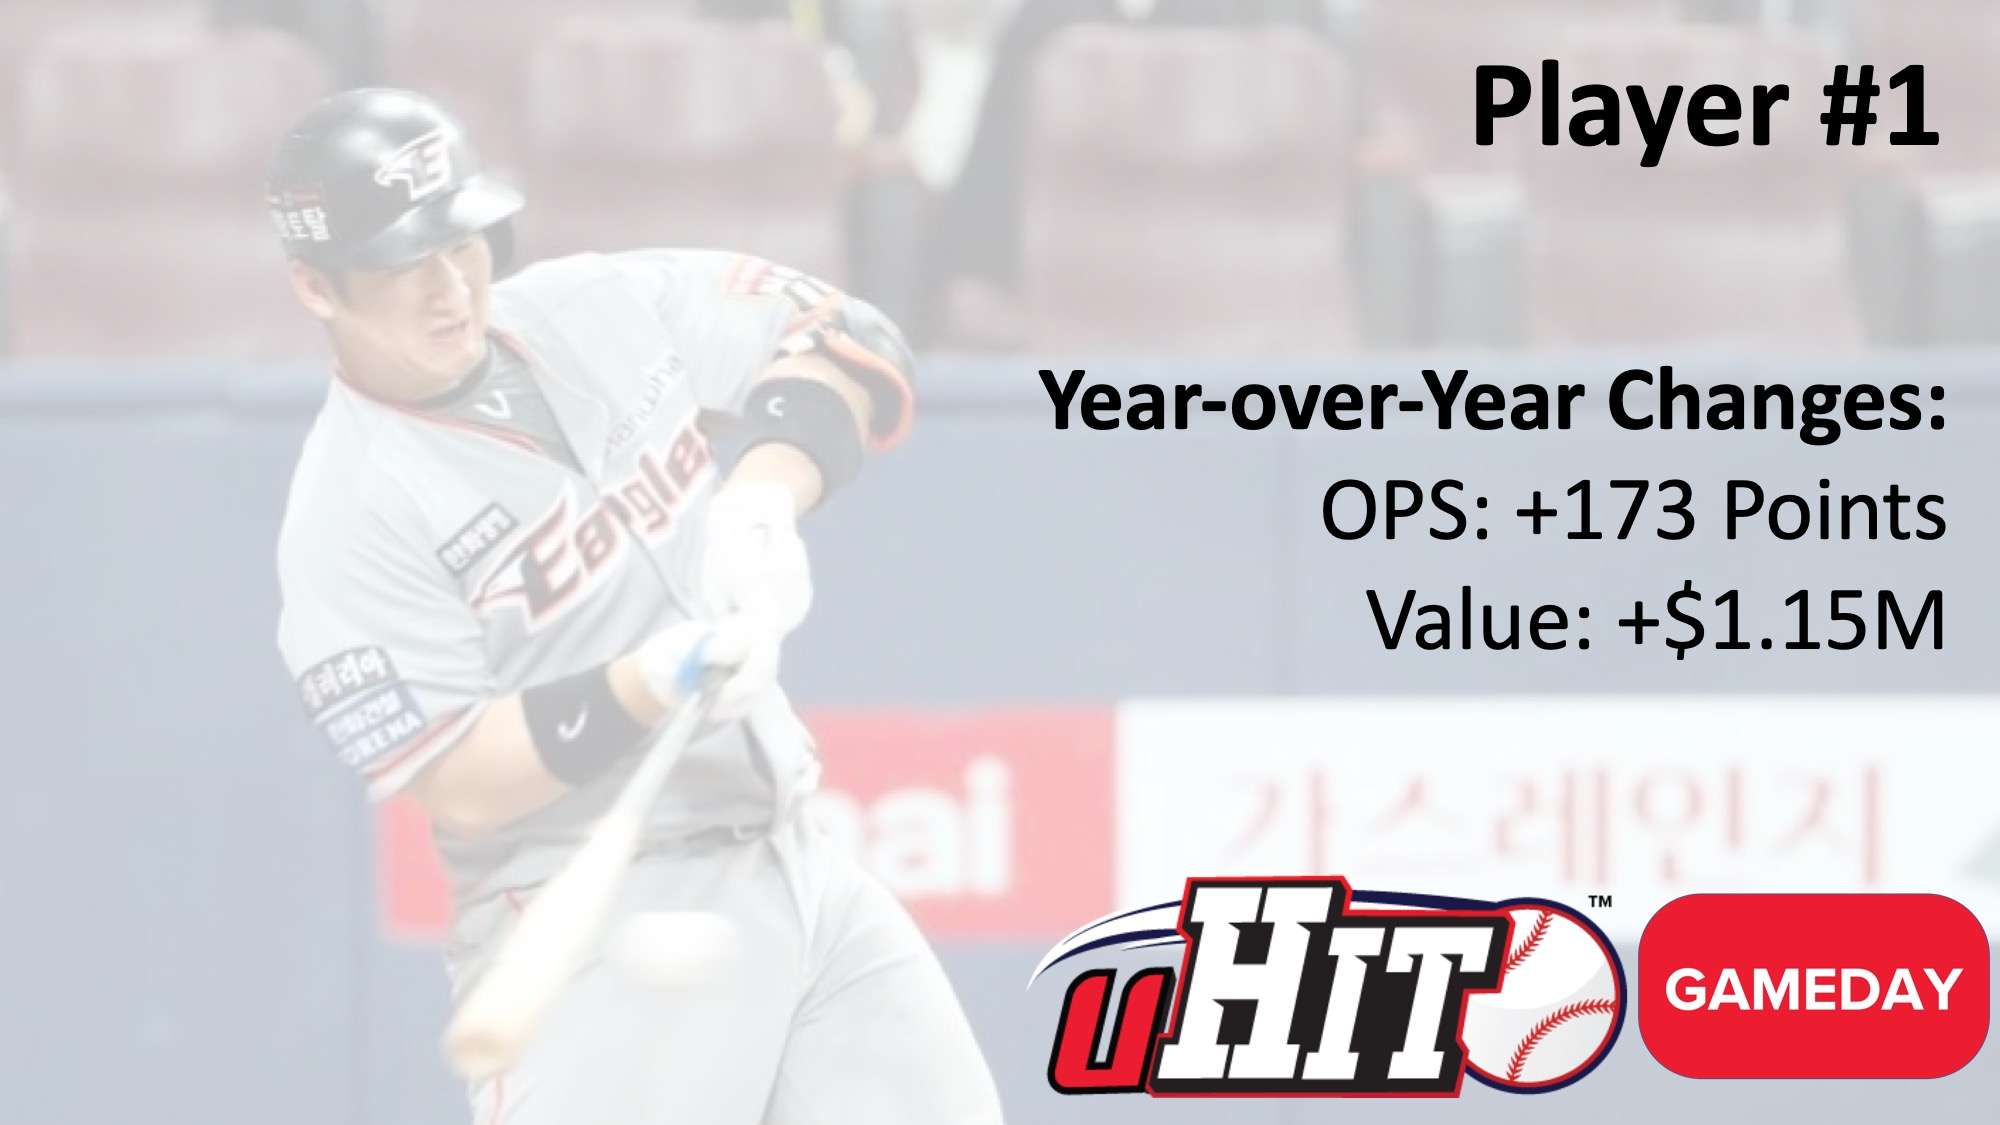
Over the 2021 season, his Accuracy in uHIT Gameday increased by +14% from where he began at the start of the season. Year-over-year (2021 vs. 2020), we looked at his key metrics on-field, including on-base plus slugging percentage (OPS). Player #1 saw a +35% increase in his OPS, landing him at 0.668 in 2021, from 0.495 in 2020, a gain of +173 OPS points.
Going back to our model for OPS vs. Standardized Salary, a 173-point change in OPS would mean a change in 0.69 standard deviations from the mean salary. In 2022, the Associated Press calculated the average salary in Major League Baseball to be $4.41M. Other estimates based on current payroll data published here corroborate this number and give us too that the standard deviation of player salary is $1.7M.
Using this salary information, this means that Player #1’s change in OPS of 173 points would be worth $1.15M in 2023 dollars.
Case Study #2: uHIT Gameday
Player #2 demonstrates a trend we see often with uHIT. That trend is for utility players to demonstrate major strides in offensive output, despite limited plate appearances. In the case of Player #2, uHIT Gameday (contact to learn more) was the tool of choice. It led him to greater offensive output when he was called upon to jump in. As we will see from the economics of developing a player this way, a team that develops a player in this way can create tremendous value. The team may then be able to barter that player for much more value than they otherwise would be able to.
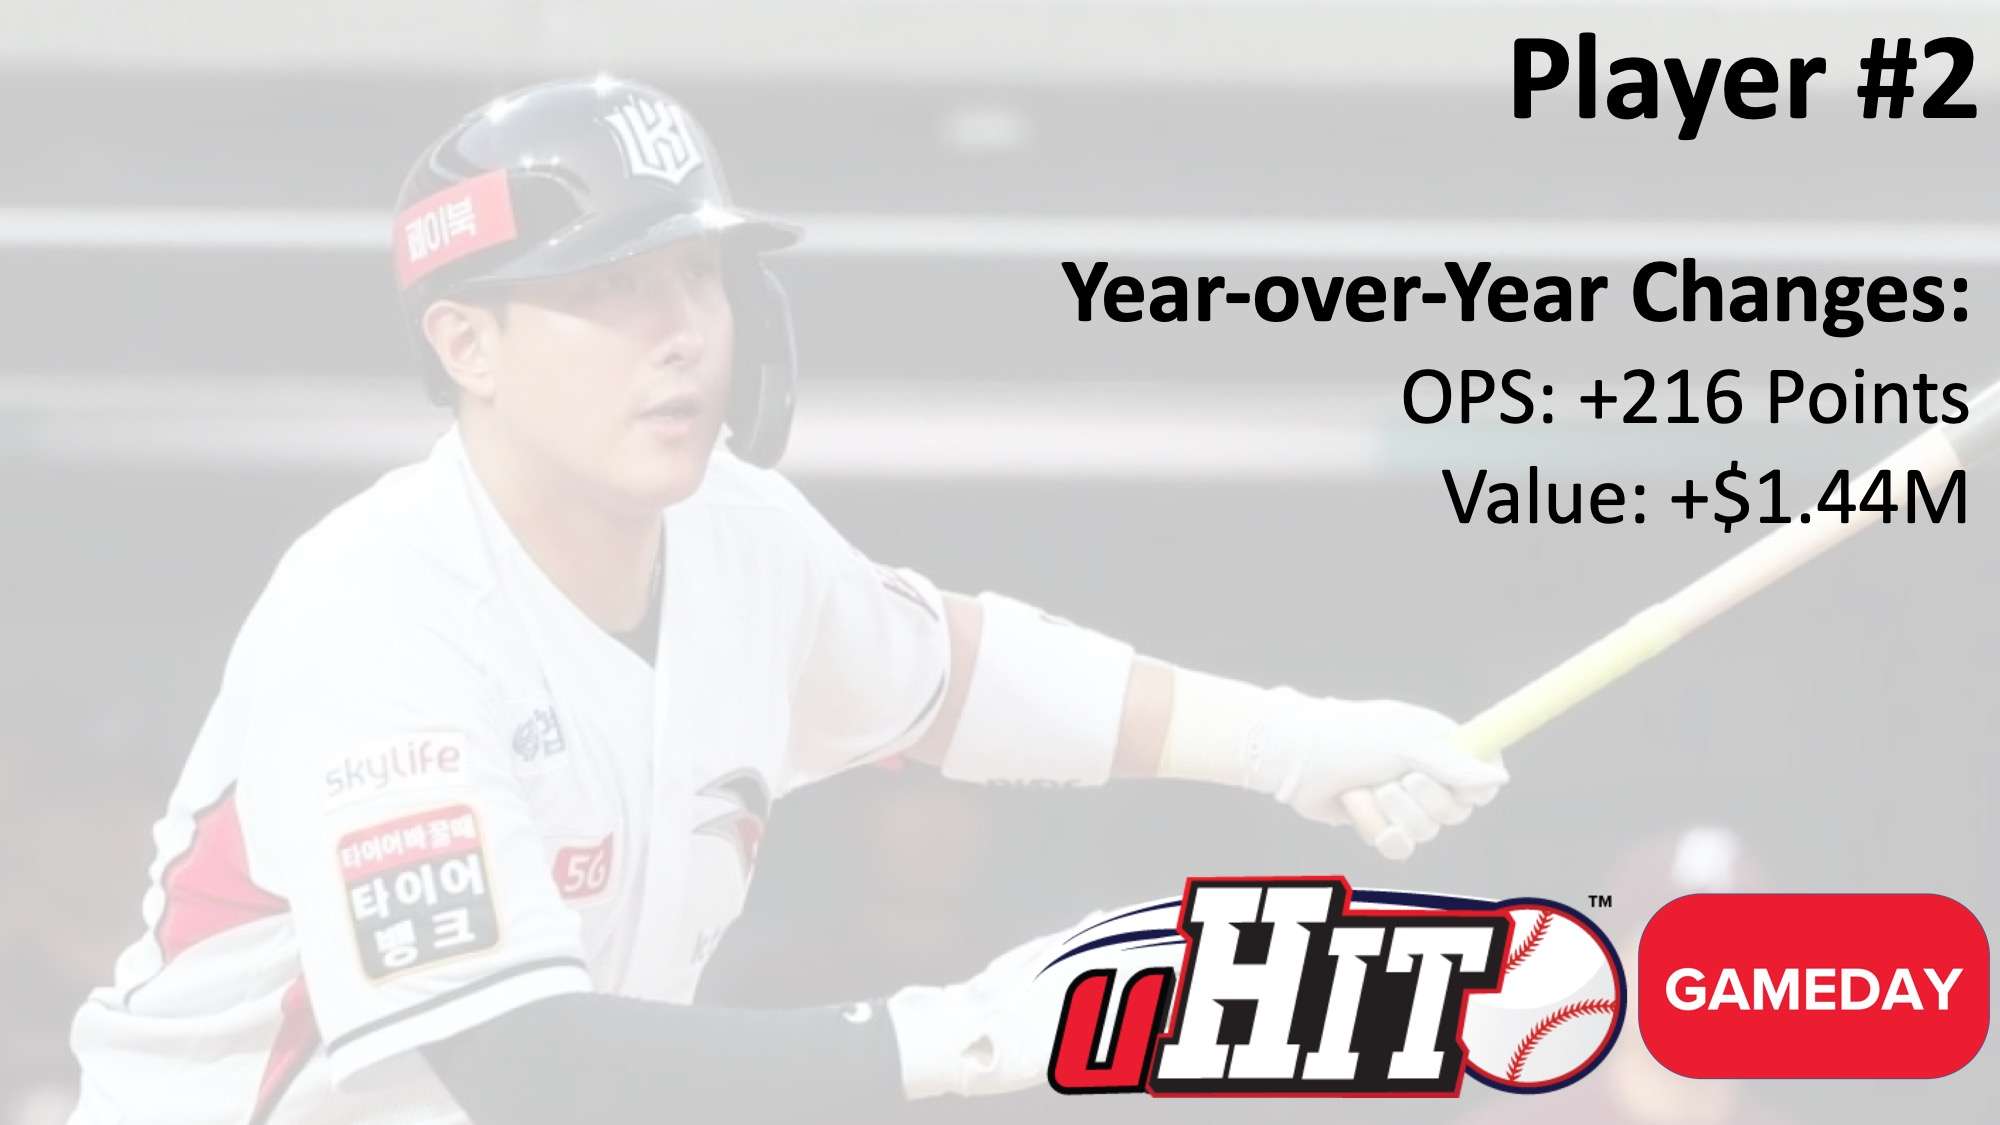
In 2021, Player #2 did 3200+ pitches on Gameday, doing more than +500% more pitches per game. The results on-field then followed. His OPS went up by +216 points, nearly doubling (+93%) year-over-year from 2020. (Sometimes we get the case that utility players just increase offensive output by having more plate appearances. But that’s not the case with Player #2. His only change in plate appearances was going from 1 out of every 4 games (2020) to 1 out of every 3 games (2021). So not a huge change in plate appearances that could account for a +93% increase in on-base plus slugging percentages.)
Now, let’s look at the economics of this change in hitting performance. This 216-point OPS change would amount to a little over 0.8 standard deviations of Standardized Salary, exactly 0.864. Using the previously calculated $1.7M as the standard deviation of 2023 salaries, Player #2’s change in OPS was worth a $1.44M change in his value in the salary market.
Case Study #3: uHIT Custom
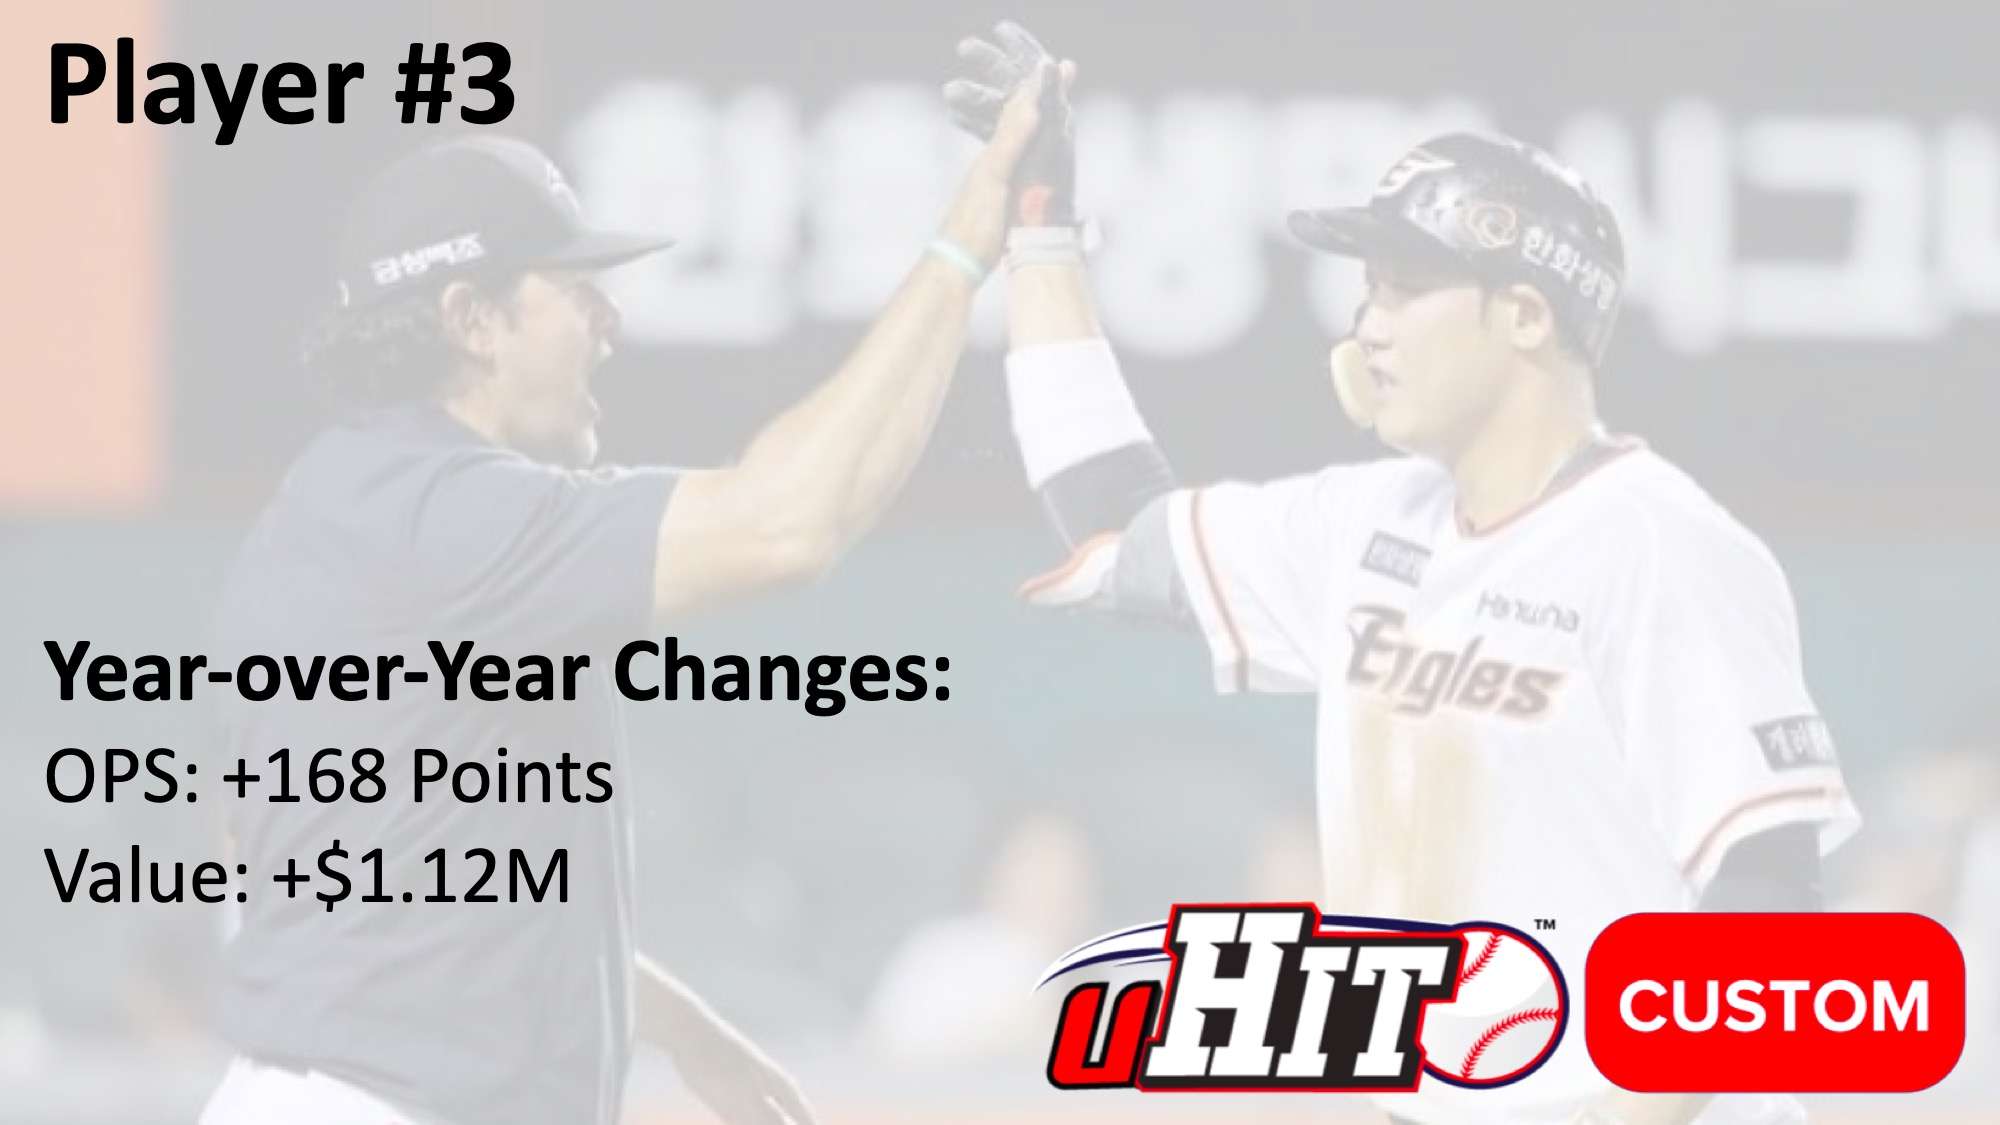
Player #3 is a textbook study on how a coach can revamp a hitter’s approach without touching his swing. Our uHIT Specialists worked with the Eagles’ Hitting Coach and Analytics Manager to implement uHIT Custom. They focused o Player #3’s Zone Recognition skills in 2020.
In 2021, Player #3 excelled at uHIT Custom. We measured this in his XP (or points) per Inning, which more-than-doubled (+101%). We also measured his Accuracy, which went up almost +9% in 2021. Recall, XP is a combination of Accuracy and Reaction Time (to the zone for strikes). So we can see that most of that +101% increase in XP per Inning is due to a faster Reaction Time to the zone.
On the field in 2021, Player #3 had a breakthrough in offensive output, particularly in power numbers. Here, we will focus again on the OPS, which went up +168 points (+25%) year-over-year. There were many contributors to that from Walk Rate (+8.2%) and Strikeout Rate (-6.4%). But the biggest change was a +50% increase in HRs. With these drivers of OPS, we will look again at the player value change from these offensive output changes.
A 168-point change in OPS corresponds to a 0.67 standard deviation change in Standardized Salary, using our model from above. Again, reflecting this in 2023 dollars, this OPS change is worth $1.12M in the player salary market.
Summary: Return on Investment
With all three players, we saw OPS changes from uHIT Gameday or uHIT Custom. These OPS changes for individual players were worth between $1.12M and $1.44M in the MLB player salary market (2023 $USD).
Many times, a team or organization evaluates an investment in uHIT by whether all or most of the players use the product on a regular basis. In practice, we find that this is usually an unattainable goal, especially in the first year of usage. Fortunately, what we also see in practice, there are always a handful of players that become dedicated users. For instance, we saw that with each of the players above for the targeted enhancement uHIT Custom or uHIT Gameday.
Still, uniformity of messaging to players is important. So we find that the best practice for implementing uHIT Custom or Gameday is to provide it to all hitters at once. For a team with 15 hitters, this investment over 12 months can reach $10,000 per year. And it can seem like a lost investment when only 1-3 hitters dedicate the time to uHIT that can produce performance changes. But as the case studies above show, if 1-3 hitters generate the changes in OPS we cite above then those gains can be worth between $1,120,000 and $4,330,000 to the team.
This is the economics argument for uHIT Custom or uHIT Gameday at the professional level. As we continue to work with pro hitters, we will be able to refine these estimates for return on investment and provide you more data on how best to invest in player development for your hitters. If you have insights to share about this analysis or an alternative way of evaluating the data, we’d love to hear from you! Please reach out to us at info@deCervo.com for further dialogue.
