Case Study
On MLB Hitter Development
Part III of III
Jan 10, 2024
In this case study on MLB hitter development, we examine all hitters using uHIT Custom from one pro organization.
What you need to know:
Counterexamples with low usage show OPS drops and other warning signs
We Track with XP. They Track with OPS.
As a top-line summary, all players who regularly used uHIT Custom showed substantial gains in on-field hitting. In this case study on MLB hitter development, we will use OPS (and its components, OBP and SLG) from publicly available sources. We tie growths in uHIT performance to on-field via this metric and uHIT’s XP / Pitch (see more here about XP / Pitch). The uHIT XP / Pitch is a measure of how accurately and quickly hitters are learning to recognize pitches and strikes/balls.
Parts I and II: Top-5 Users of uHIT Custom
We gauge uHIT effects by looking at regular users of the training (see more here for Part I and here for Part II). From top-5 in usage (measured by Pitches Completed on the uHIT Dashboard), we found hitters who were regular uHIT Custom users. We looked at top-5 usage for each of the skills worked in uHIT in-season (Pitch, Sub-Zone and Whole-Zone Recognition). The top-5 threshold ensured that the players had done at least 1000 pitches on uHIT in the 11 months of in- and off-season usage. Although usage fluctuated by the demands of the year, this amounted to a usage of ~90 pitches per month (about 20 minutes of uHIT usage monthly).
Even with this small investment of time, the gains in OPS in some cases were tremendous, netting a substantial return on our client’s investment.
Part III: Bottom-2 Users of uHIT Custom
As a set of counterexamples. we also looked at players who did not use uHIT regularly. We regularly get asked ‘how do you know you’re not cherry-picking results?’ or ‘maybe the other training the hitters did produced these effects?’ By looking at hitters in the same organization, we can reasonably say that all hitters’ training outside of uHIT Custom was relatively similar. For instance, they shared the same strength & conditioning coaches, nutritional programs, and live batting practices. Also, there cannot be cherry-picking when we’ve selected players only by how much they used uHIT Custom. Within this MLB organization, there are no other hitters who used uHIT Custom as consistently as the top-5. And we selected the counterexamples with similar dispassion. Specifically, the counterexample hitters were the bottom 2 in training usage, also measured by Pitches Completed on the uHIT Dashboard.
Within the organization, these players provide the best means of being a counterexample that might be generalized to other players who did not use uHIT Custom this season. It’s not a perfect comparison. But considering the many factors of the real-world, this is a great way to gauge what added value (above status quo) uHIT Custom adds. Overall, the bottom-2 hitters’ on-field hitting showed either a downward trend, or clear warning signs about performance.
A Note on Hitter’s Names: Top-5 Users
Getting back to the top 5 players, these hitters averaged at least 90 pitches monthly (1000 pitches all year) across either Pitch or Zone Recognition Training. In this three-part case study on MLB hitter development, we will refer to them anonymously (as we do with the bottom-2). We do this both to protect their non-public data and to illustrate deCervo’s commitment to helping its clients excel (see other MLB studies here). The hitters will be known as:
- Hitter #1
- Hitter #2
- Hitter #3
- Hitter #4
- Hitter #5
- Hitter #6
- Hitter #7
Three of these players hit this usage minimum in both Pitch and Zone Recognition Training (e.g., Player #1). That’s why there are not 10 hitters total (two sets of 5 hitters for each skill). And this is a common observation with our training: the hitters that are serious about part of it are usually serious about all of it.
A Note on Hitter’s Names: Bottom-2 Users
For this post on counterexample hitters, we consider the bottom-2 performers by usage in Pitch and Zone Recognition on uHIT Custom. There are two hitters in Pitch and two in Zone Recognition, making four total. We will refer to them in this post as:
- Bottom #1
- Bottom #2
- Bottom #3
- Bottom #4
These four hitters give us a way of seeing how not using uHIT Custom impacts here the case study on MLB hitter development. With that in mind, it’s time to analyze how these hitters’ performance evolved in uHIT and on-field this year. We welcome your feedback and analysis on these players in the comments below. You can also ask questions on our social media (here or here).
Counterexample, Bottom #1
Counterexample, Bottom #1
Below, we begin by looking at a) Bottom #1’s Assessment, b) the minimal training he began, and finally 3) what he did at the plate.
Questions to consider as we go through this and other players in this case study on MLB hitter development:
- What problems could we see from his Assessment?
- What solutions was he just scratching the surface of before letting the training go?
Bottom #1’s Assessment
Bottom #1 (“B1”, for short) had a decent Assessment in Zone Recognition. His Accuracy of 73% and Reaction Time of 0.446sec put him at an average of 58 XP / Pitch. This put him in the 2nd quartile (top 50-25% of hitters) of this skill.
When we broke down his assessment by zone we saw a preference for pitches (balls and strikes) on the inner half of the plate. Being a right-handed hitter, he either tapped for more strikes inner part of the plate, or did so for balls just off the inside part of the plate. You can see this in the breakdown by Zone Accuracy and Reaction Time below:
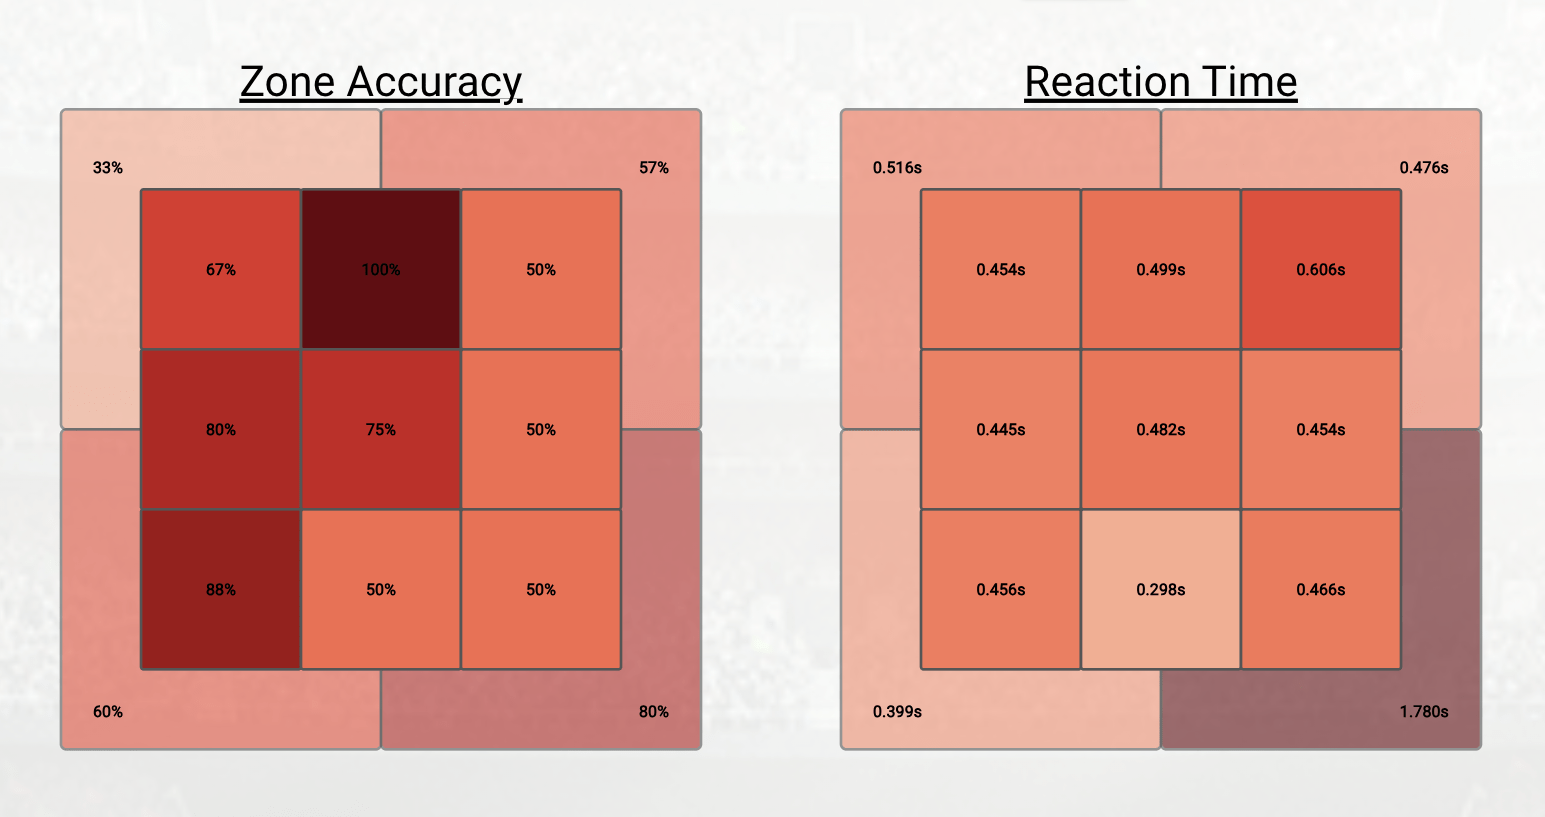
Bottom #1’s Preference for Inner-Plate Pitches
On the inner third of the zone, B1 shows 67%, 80% and 88%. But on the outer part of the zone, he shows 50% for all three zones top to bottom. This shows a strong tendency for pitches inner part of the zone, but statistically no ability to discriminate outer third strikes from balls. When we look at the ball zones, inside pitches are correctly taken 33% and 60% of the time, meaning he’s errantly swinging at balls inside 67% and 40% of the time top to bottom. Conversely, when we look at balls off the plate, he’s taking them at 57% and 80%, meaning he errantly swings at them 43% and 20% of the time.
There are two possibilities from this analysis. First, B1 may just be an inner-zone hitter and he could be coached this way. This could be why he shows a propensity for inner plate pitches, either balls or strikes. Second, and more common, he’s not seeing the difference between balls and strikes on the outer third. Furthermore, he’s not registering the feedback given to him in uHIT Custom Training that he is incorrectly tapping for balls and taking strikes. This is a vital skill to learn, regardless of B1’s pitch preferences. And this is a part of his Zone Recognition skill we would target in a uHIT Custom training program.
Bottom #1’s uHIT Custom Training: Stopped By Adversity
Of all org hitters, Bottom #1 (B1) used Zone Recognition for the least amount of measured pitches (only 54). In those 5 sessions, he averaged a higher Accuracy (86%) and and a greater XP / Pitch (80.4). A great part of this improvement was due to him getting slower pitches with less tunneling in these early rounds of training. For instance, the Assessment had been for pitch speeds ranging from 75-90mph (see more about our Assessments here). But on B1’s first training inning, the uHIT Custom program dialed him down to 71-75mph. This greater time caused B1’s Reaction Time to slow down to 0.532sec. But that’s where his training ended.
B1 breezed through four innings of Zone Recognition uHIT Custom Training. But at the 5th inning, he faltered and never got back up. He logged no more sessions of uHIT Custom after this initial failure. This is an important theme to recognize from this case study on MLB hitter development. It shows how a hitter can coast while it’s easy, but give up when he meets a failure. Our goal in training is to guide the hitter (and his coach) through that barrier. It’s always better to do so before they are back on the field. (Contrast this behavior with the success of Hitter #1 from Part I: He failed hundreds of his 2300+ sessions in uHIT Custom, but eventually broke through each of his toughest innings. And we saw the 400+ OPS points he gained from doing so, along with the $2.4M in player value.)
Bottom #1 On-field Hitting: OPS drops
For first year hitters, the best way to evaluate progression over time is to look at pre/post periods of hitting. Fortunately, with B1, we know that on July 25 he moved teams in the Dominican Summer League. So we can take this date as a dividing line to track progress. Unfortunately though, at the same time his hitting was falling off, we saw a decrease from pre-July 25 on DSL Blue to post-July 25 on DSL Red in 2023 (OPS of 0.841 to 0.654, see below from milb.com):

As we know from the org coaches (see Part I), there is no difference in the competition between these two levels. While we can only guess from available data, it is likely that opposing pitchers learned about B1’s weaknesses (maybe the outer third of the zone) and exploited that to negatively affect his OPS. With more training on uHIT Custom, we hypothesize that we would have minimized that weakness and it may have shown up in his OPS. We can only hope that next year we get the chance to help B1.
Counterexample, Bottom #2
Counterexample, Bottom #2
As with Bottom #1 (B1), we begin by looking at a) Bottom #2’s Assessment, b) the quality of his training, and finally 3) what he did at the plate.
A noticeable difference with B2 is that he was a bottom-2 user of one skill training (Pitch Recognition). But he crammed about one week of skill training in another skill (Zone Recognition) during his short time with uHIT Custom. His case illustrates a general trend we see from this case study on MLB hitter development. That is, hitters only improve with uHIT Custom when the training is consistent (see this 8-week case study with another MLB org as an example of this).
Bottom #2’s Assessment
Bottom #2 (“B2”, for short) had clear skill deficits visible in his Assessment on both Zone and Pitch Recognition. In Zone Recognition, his Accuracy of 64% and Reaction Time of 0.418sec put him at an average of 23 XP / Pitch. In Pitch Recognition, his Accuracy of 47% and Reaction Time of 0.411sec put him at an average of 48 XP / Pitch. This put him at about the 50th percentile for both skills.
We broke down his assessment in Pitch Recognition by looking at how his decisions went when he expected one type of pitch and was thrown a different type. For instance, you can see below that when he expected a Fastball and was thrown a Curveball, he took those pitches 33% of the time. But conversely, when he expected a Curveball and was thrown a Fastball, he took those pitches 0% of the time:
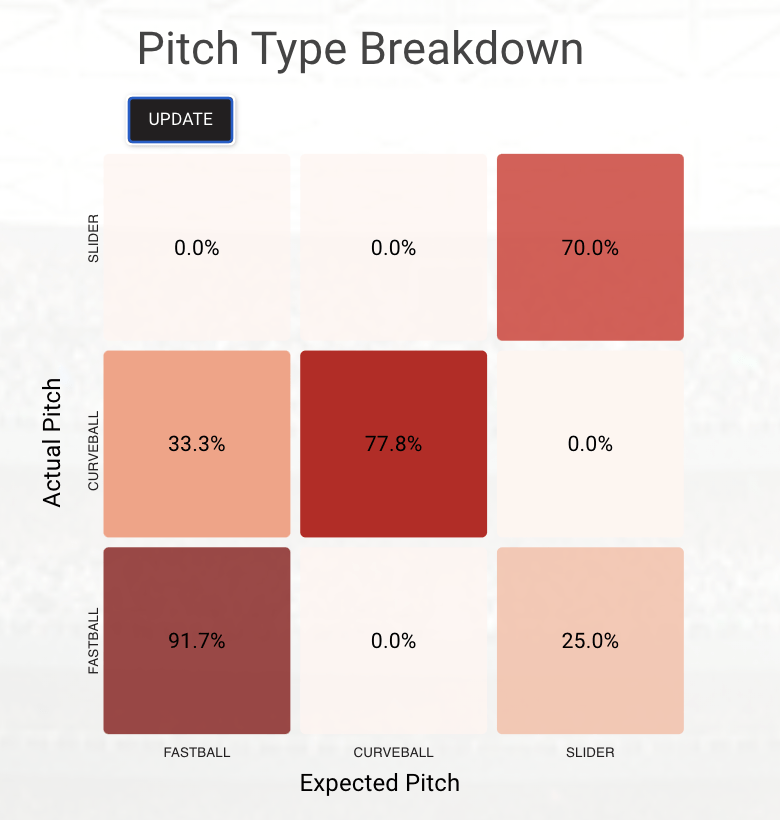
The diagonal (upward to the right) shows how often he correctly recognized the pitch he was expecting. Of these pitches, Sliders were the hardest for him to connect recognition to action for (70% Accuracy).
Bottom #2’s uHIT Custom Training: Short & Shallow
Bottom #2 (B2) showed a brief surge of training early on. In one week, he completed one round (9 innings) of Zone Recognition training. This round reduced the pitch speeds drastically from the Assessment (down to 71-76mph). But this added time helped B2 get more time to decide in vs. out of zone, so that he averaged 69% Accuracy (up by 20 points from his Assessment performance).
And then B2 dropped uHIT Custom for one month. At that point, he dabbled in two innings of Pitch Recognition training, netting 12 pitches there. This was the second lowest number of pitches trained in the org for this skill.
Bottom #2 On-field Hitting: OPS drops
As with B1, we look at B2’s pre/post periods of hitting. In his case, he moved teams in the Dominican Summer League on June 12. So we can take this date as a dividing line to track progress. It does not leave a large sample size for the pre-June 12 period (21 ABs). But there is enough the gauge his on-field hitting during this time with a reasonable degree of accuracy. Using this marker in the season, We saw a massive decrease across 2023 from pre-June 12 on DSL Red to post-June 12 on DSL Blue (OPS of 1.322 to 0.632, see below from milb.com):

As we know above, there is no difference in the competition between these two levels. While we can only guess from available data, it is likely that opposing pitchers learned about B2’s weaknesses too. With more training on uHIT Custom, we hypothesize that we would have minimized that weakness and helped his OPS. As with B1, we can only hope that next year we get the chance to help B2.
Counterexample, Bottom #3
Counterexample, Bottom #3
For Bottom #3 (B3), we will take a more abbreviated look than we did with the previous two hitters. The same themes emerge though for slightly different training behavior. As above, we begin by looking at a) Bottom #3’s Assessment, b) the quality of his training, and finally 3) what he did at the plate.
An important difference with B3 is that he used a general skill training not as specific as his uHIT Custom Zone Recognition training. This is a common misstep when coaches are not there to guide hitters when they use uHIT Custom. In this case study on MLB hitter development, B3 did some training in our cheaper option, uHIT Plus (see more here). As above, he only did so over a few days. While uHIT Plus training is not detrimental by any means, it is not as targeted as uHIT Custom Zone Recognition training is to strengths and weaknesses. He was a bottom-2 user of one skill training (Zone Recognition).
As with B2, he crammed his skill training into a short period of time without any consistent followup. His case too illustrates a general trend we see that hitters only improve with uHIT Custom when the training is consistent. See this 8-week case study with another MLB org as an example of the difference this consistency can make.
Bottom #3’s Assessment
B3 had clear skill deficits visible in his Assessment on both Zone and Pitch Recognition. In Zone Recognition, his Accuracy of 61% and Reaction Time of 0.394sec put him at an average of 49 XP / Pitch. In Pitch Recognition, his Accuracy of 50% and Reaction Time of 0.432sec put him at an average of 13 XP / Pitch. These Assessment numbers put him at about the 50th percentile for both skills.
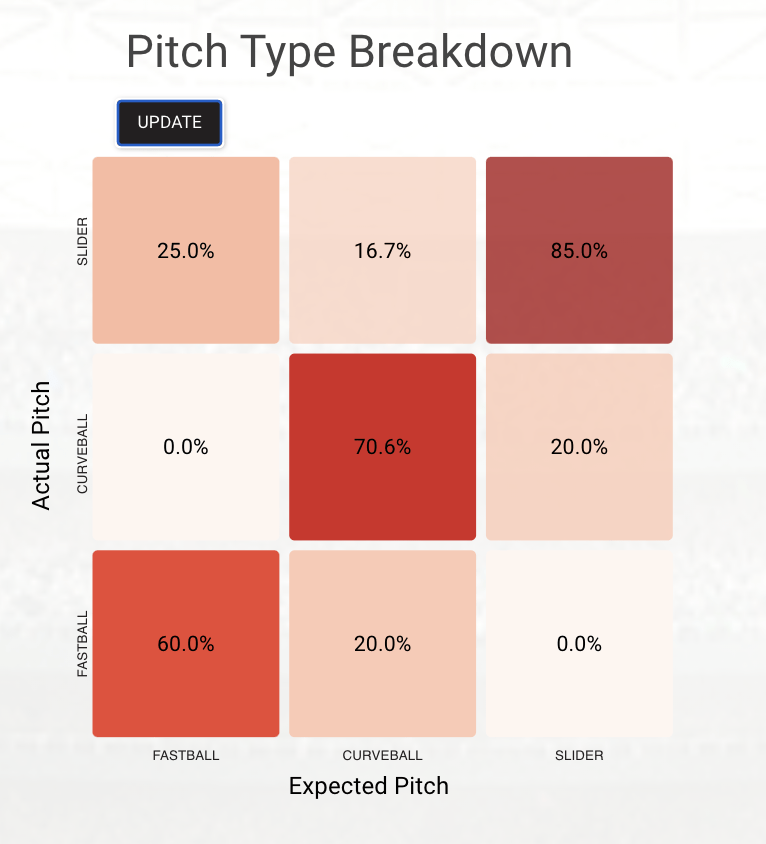
As for B2, we broke down B3’s assessment in Pitch Recognition. We did so by looking at how his decisions went when he expected one type of pitch and was thrown a different type. Can you tell which pitches he had the hardest time recognizing? (Hint: the bottom row tells a lot about problems recognizing Fastballs)
Bottom #3’s uHIT Custom Training: Undirected and Quick
Bottom #3 (B3) too did a brief amount of training. In one day, he completed five innings of a generic (not specific to him) Zone Recognition training. When he reached a barrier in the 6th inning, he stopped. He returned a few days later to try passing this level again, but failed. There were no more attempts afterwards.
Again, as with B1, we see a clear indicator about how B3 handled the adversity of not passing this 6th inning. He coasted through innings while he advanced in pitch difficulty, but as soon as he hit a barrier he abandoned his training. Unfortunately, this is a common theme with many hitters who reach opposing pitching that gets the best of them too. We just see it quicker in uHIT.
Bottom #3 On-field Hitting: SO/BB Red Flags
He had a short stint at DSL (9 ABs), spending most of the year after June 12 at ACL (42 ABs). It’s not easy to tell the progress from DSL to ACL, but he has a K/BB ratio of 1.5 in ACL (18/12 = 1.5). His OPS dropped from 0.733 to 0.692 (see below from milb.com). But that might also be due to the higher level of play between DSL and ACL. Still, considering both data points together, we did not see gains in this hitter’s OPS while he minimally trained with uHIT.

As we know above, there is no difference in the competition between these two levels. While we can only guess from available data, it is likely that opposing pitchers learned about B2’s weaknesses too. With more training on uHIT Custom, we hypothesize that we would have minimized that weakness and helped his OPS. As with B1, we can only hope that next year we get the chance to help B2.
Counterexample, Bottom #4
Counterexample, Bottom #4
Bottom #4 (B4) is a special case. He’s a high-value prospect, newly drafted into our client’s org in 2023. This makes him a unique case study on MLB hitter development. In his case particularly, we noted items from his Assessment that it would be wise to rectify soon in his development. He was not a consistent user of uHIT Custom though (thus his inclusion in this Bottom-2 group). Moreover, we saw a host of signs from in-season hitting that put at risk his smooth transition to higher levels of play. As with the above hitters, we begin by looking at a) Bottom #4’s Assessment, b) the quality of his training, and finally 3) what he did at the plate.
Bottom #4’s Assessment
B3 had clear skill deficits visible in his Assessment on both Zone and Pitch Recognition. In Zone Recognition, his Accuracy of 61% and Reaction Time of 0.394sec put him at an average of 49 XP / Pitch. In Pitch Recognition, his Accuracy of 59% and Reaction Time of 0.395sec put him at an average of 48 XP / Pitch. These Assessment numbers put him in the lower third quartile for both skills.
As for prior hitters, we broke down B4’s assessment in both Pitch (1st) and Zone Recognition (2nd). In Pitch Recognition, can you tell which pitches he had the hardest time recognizing? (Hint: look at the third column, when he is expecting the sideways movement of a Slider)

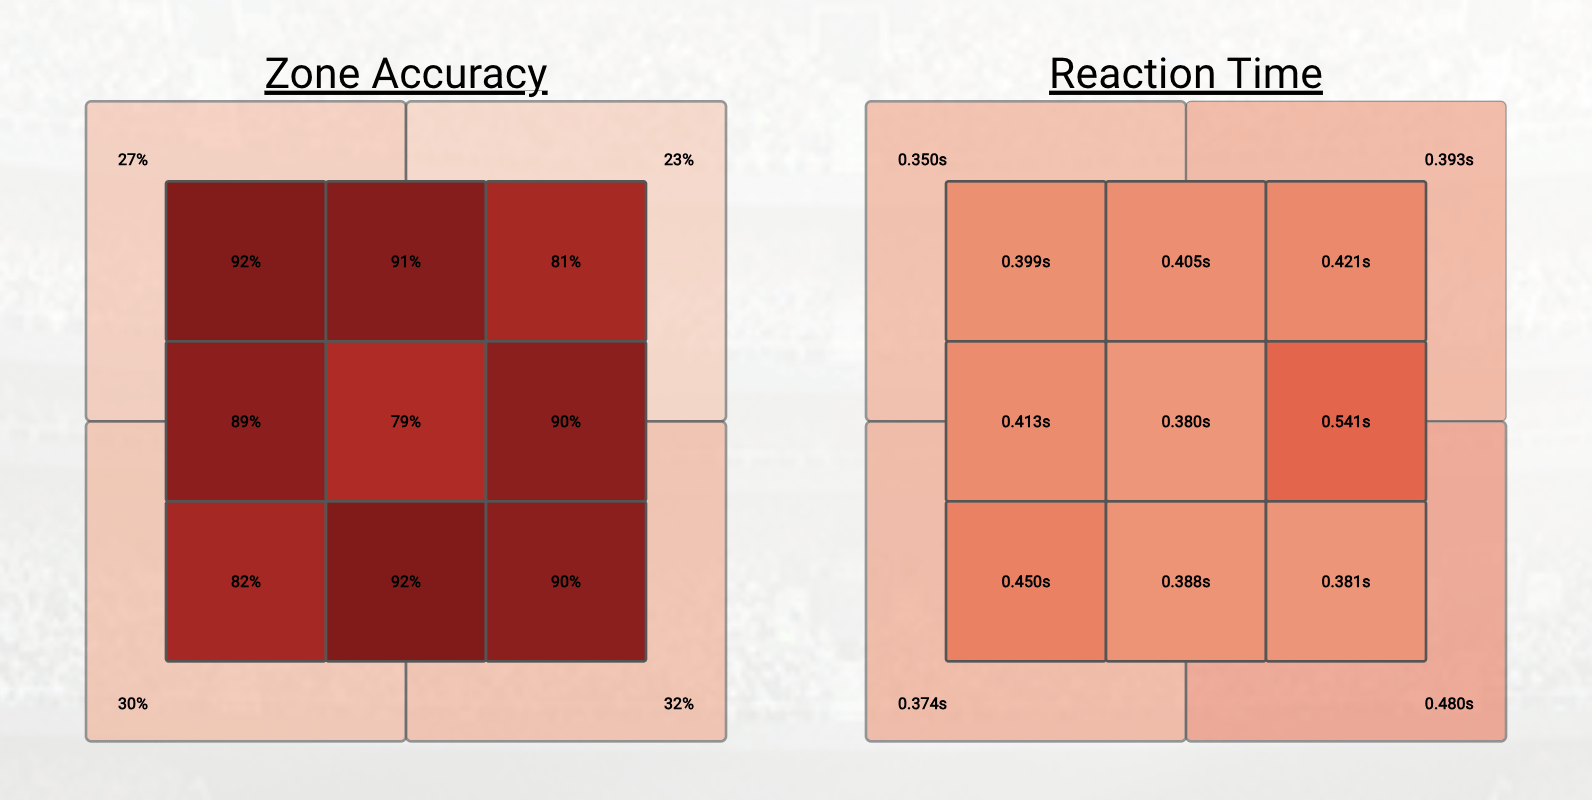
Issues on Horizontal Movement and Taking Balls
A few things stand out from considering both of these Assessments. First, B4’s ability to see horizontal movement stands out as a problem. We know this from looking at his performance when expecting a Slider. 66% of the time he recognizes the Slider after expecting it (top right corner of upper plot). But he recognizes the different shapes of a Curveball or Fastball 0% of the time (both boxes below in rightmost column).
Contrast this approach for gauging horizontal movement to those of other cognitive skill tools (such as this or this). In both examples, the actual task of time-pressured pitch identification is not the skill being tested. Instead, a generic measure of the ability to see horizontal movement is the result from a baseball non-specific task. Unfortunately, this ‘first principles’ approach to vision does not work well for gauging how a complex system — like a hitter’s brain — works. Our research has shown (see here) that the task has to be hitting-specific. This is the only way to elicit the varied neurological structures working in sequence to select and hit a pitch.
We can also gauge B4’s ability to lay off pitches out of the zone. We see he has high Accuracy in the strike zone (79-92% across nine zones) of the lower plot. But his Accuracy in taking balls out of the zone ranges from 23-32%, meaning he’s tapping for out-of-zone pitches 73-68% of the time. With this type of decision-making, we would expect B4 to show on-field a high strikeout-to-walk ratio (SO/BB).
Bottom #4’s uHIT Custom Training: Minimal
During the 2023 season, B4 used uHIT Custom for one inning, totaling just 6 pitches. He was the lowest user of Pitch Recognition Training across the org. Because of this, he provides a good counterexample to our high-usage hitters from part I and part II of this case study on MLB hitter development. In the case of such a high-value hitter like B4 though, we have worked with org management to more regularly get him into his training in 2024. We look forward to helping him continue his development to realize the promise of his multi-million dollar signing bonus.
Bottom #4 On-field Hitting: Warning on Strikeout-To-Walks
B4 made a quick move from DSL to ACL after entering the org. He spent most of the year at ACL. On September 3, he spent the rest of the season at A+. He saw a sharp drop from his ACL performance (0.544 OPS from 0.849 OPS at ACL), but that could be from the higher level of pitching too. The biggest concern we saw is a high K/BB ratio (51/10 at ACL in 143 ABs). And this lines up with what we noted above in his Zone Recognition Assessment.

Strikeout-to-walk ratio is not always what we examine to see how recognition skills translate to the field. But in the case of B4, he made a good transition from DSL to ACL. His OPS in a short time at DSL was 0.704, while in ACL, he hit 0.849. At ACL, the high SO/BB ratio (>5) tells us that he is regularly missing strikes or swinging at balls.
Furthermore, he’s likely not adjusting his strategy deep in the count. We see this because of the concurrence between his Zone Recognition Assessment above and this high number of strikeouts. In the Assessment, he’s tapping for balls out of the zone 70% of the time or more. So on the field, he’s more likely to gather three strikes in one at-bat than he would be taking some of these pitches (see this case study where we showed out-of-zone take (OZ-take) increase for hitters regularly using uHIT Custom).
Summary
There are two common themes across these four hitters. First, we see how each hitter’s Assessment showed us and the org where the problems might emerge. On the field, we saw these problems appearing in traditional metrics, like OPS and SO/BB ratios. Second, the minimal usage on uHIT Custom covered a broad range of ways the training can be an organizational challenge without proper coaching. One player used a general training program not specific to his strengths / weaknesses. Another hitter gave up after encountering some adversity in the skill development program of uHIT Custom. Both of these behaviors can be guided by coaches for a successful completion of uHIT Custom Training.
These counterexamples show us a difference with the top-5 users of Part I and Part II. But they also show coaches what pitfalls to watch out for when using uHIT Custom to train your hitters. As such, this case study on MLB hitter development shows us not only how things went wrong, but also how things can be made right when they do.

Hello, you’ve done a fantastic job. I’m sure my friends will find it helpful, so I’ll check it out and tell them about it.
I am not sure where youre getting your info but good topic I needs to spend some time learning much more or understanding more Thanks for magnificent info I was looking for this information for my mission
I do not even know how I ended up here but I thought this post was great I do not know who you are but certainly youre going to a famous blogger if you are not already Cheers