
Part 2 of MLB Org Training Case Study
17 Hitters
One Affiliate
May 1, 2024
Part 2 of MLB Org Training Case Study is a look at what on-field results in OPS we found with uHIT results documented in Part 1
What you need to know:
Hitters increased OPS by +103 points on average while learning pitch and zone skills with uHIT training
Part 1 and Part 2 Overview
Part 1 of MLB org training case study showed what effects uHIT Plus training had on hitters of one org’s affiliate (see more here). We recounted how the assessments in zone and pitch recognition were given to all hitters before they began the 2016 AZL season. Re-assessments were given at the end of the season. To close Part 1, we examined the changes from the start to the end of the season, as measured in uHIT. In Part 2, we do a similar analysis looking at the changes on-field for these hitters. Specifically, we will focus here on year-over-year OPS changes, considering them in tandem with contemporary changes in uHIT metrics.
Pitch Recognition Changes (Part 1)
In Part 1 of MLB org training case study, we focusedd on the three most important metrics of uHIT training. These metrics are important for a hitter using uHIT if using uHIT Plus, uHIT Custom (see here) or uHIT Gameday (see more here). Specifically, we examined the hitter’s Accuracy, Reaction Time (for ‘yes’ decisions) and XP / Pitch (or Points Per Pitch). These metrics told us on a high-level how well and quickly a hitter was recognizing pitches (see more from other case studies here).
We examined what changes in pitch recognition skills occurred in this org affiliate’s hitters. Before uHIT Custom, these hitters had used uHIT Plus, a more self-guided mode to uHIT training. In Part 1, we largely found that regular use of uHIT Plus 1) increased Accuracy, 2) decreased Reaction Time (for ‘yes’ decisions), and 3) raised XP / Pitch. The last metric most of all was important to this analysis because it is a combination of accuracy and decision speed isolated to each pitch.
Zone Recognition Changes (Part 1)
Also in Part 1 of MLB org training case study, we did a similar analysis for zone recognition skills. Here too, all hitters used uHIT Plus as a self-guided practice to improve their in-zone / out-zone recognition skills. Without the automatic customization of uHIT Custom, we largely found also 1) an increase in Accuracy, 2) decrease in Reaction Time and 3) an increase in XP / Pitch. But zone recognition training was much tougher in 2016 on uHIT (see more here). Since then, we have tempered it to more appropriately match a hitter’s ability in uHIT Custom. We saw impacts from this heightened difficulty when we evaluatedd the performance changes seen for these hitters from the beginning to end of the 2016 season.
OPS Changes (Part 2)
Now, in part 2 of MLB org training case study, we look at what effects we saw on-field. Specifically, we examine the OPS changes these hitters demonstrated from 2016 ahead to 2017. By looking at the following season, we further tested an observation we’ve made with other pro hitters (see here). In particular, we tested whether the lessons learned for pitch and zone recognition skills would transfer from one year to the next. The data shows us they largely did. In Part 2, we dive into those details.
Some Notes About the Data (Part 2)
Finally, we sum up the last part with some notes on how we found / chose on-field data. Sometimes players are released or play at different levels from year to year. Here, we will talk about our decisions to most judiciously select on-field OPS metrics to test our hypothesis of contributing to year-over-year OPS changes.
OPS Changes
Year-Over-Year Or The Closest Analog
Of the 17 hitters we worked with in 2016, most played in 2017 at the same level (AZL). One was promoted to Low A. One was released and played in Mexican AAA. Finally, one more played the rest of the 2016 season at a comparable full season affiliate, so we were able to use his “post” data from 2016. All other hitters were compared at the AZL level from 2016 to 2017 as their pre vs. post measurement in OPS.
Results Summary
Across 2016, we found average scores across the hitters of:
- OPS: .601
There was not a lot of variability in these scores. We evaluated the spread in these values using the standard error (see here):
- OPS: +/-.036
These measurements were from on-field results while doing the uHIT training.
The following 2017 season, we found average scores across the hitters of:
- OPS: .704
There was comparable variability in these scores too. We evaluated the spread in these values using the standard error again:
- OPS: +/-.032
These measurements were from on-field results after the season of uHIT training. To our knowledge, none of the hitters were provided uHIT training during this time period. (The org opted instead to prioritize its spending to give the uHIT Assessment to all org hitters, instead of focusing on training a select group)
We can visually see the difference in year-over-year OPS below. For connection to Part 1, we have plotted the XP / Pitch change too.
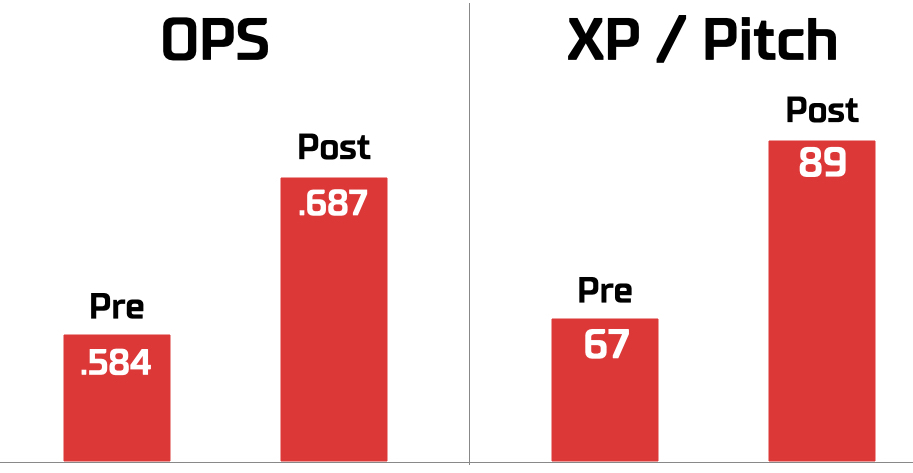
Statistically Relevant Change in OPS
Visually, the plot tells us that OPS changed year-over-year for these hitters. The XP / Pitch changes from beginning to end of 2016 chart their learning going into 2017. Our aim with any uHIT training period (Plus, Custom or Gameday) is for OPS to increase (see Part 1 for this aim in terms of XP / Pitch). We can test that aim (or hypothesis) statistically by using a one-sided t-test (see here for more). Specifically, we hypothesize that:
- OPS of 2016 is less than OPS of 2017
With a one-sided t-test of each of these statements, we can provide the probability chance that the statement is correct. We get for this hitting summary metric the following:
- OPS: 99.7% the statement is correct
In other words, we can say with high certainty that our aim was met for hitters using uHIT Plus to improve their OPS in this AZL affiliate. By most standards of statistical tests (see here), we would claim that the intervening months of 24 sessions (+/-2) on average helped these hitters perform better on-field.
Some Notes About The Data
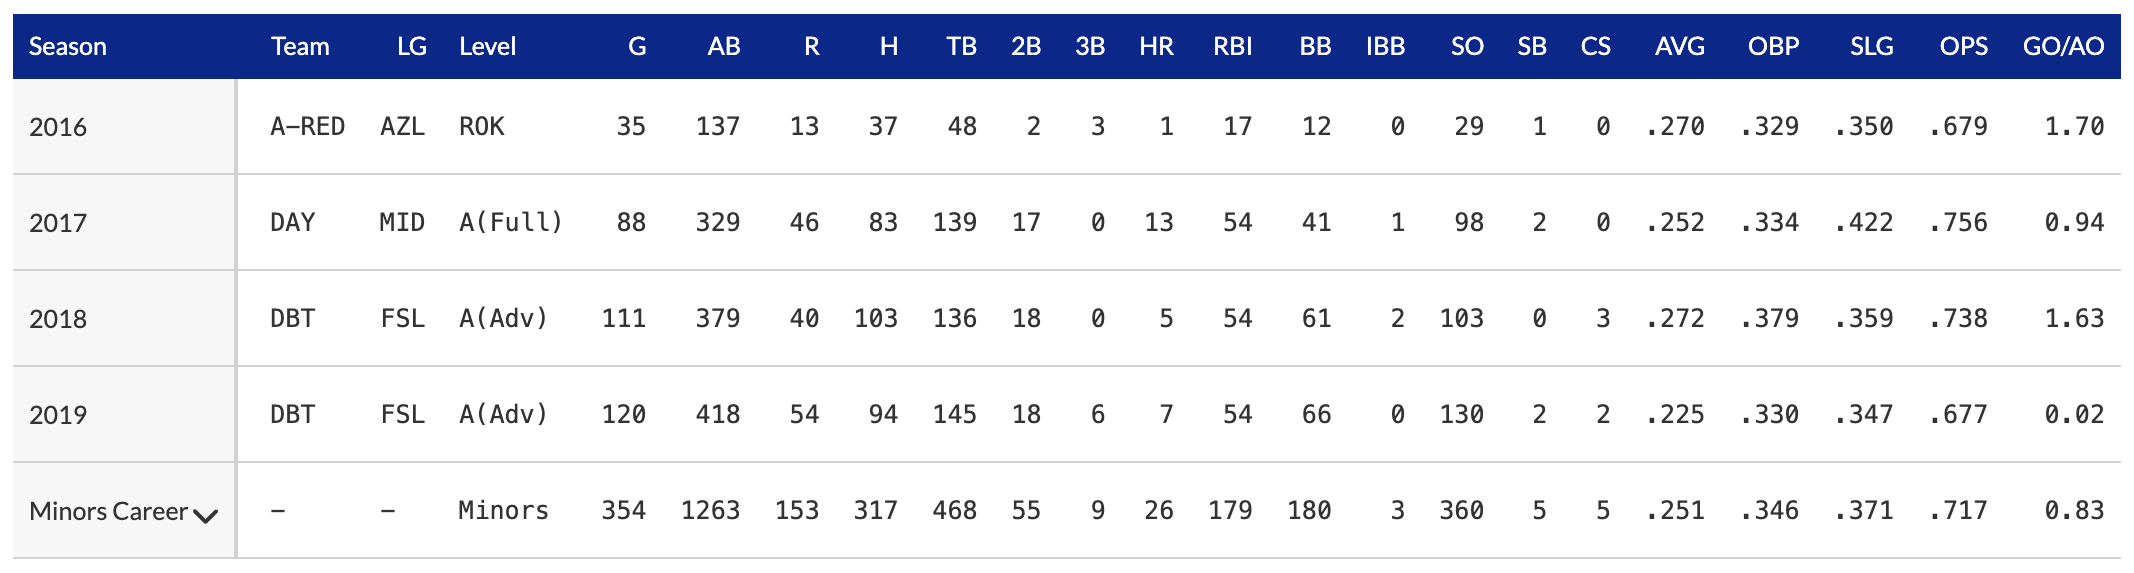
The Straightforward Comparisons
14 of the 17 hitters had simple comparisons between AZL OPS in 2016 and 2017. An example of one of these comparisons available from milb.com is shown below:
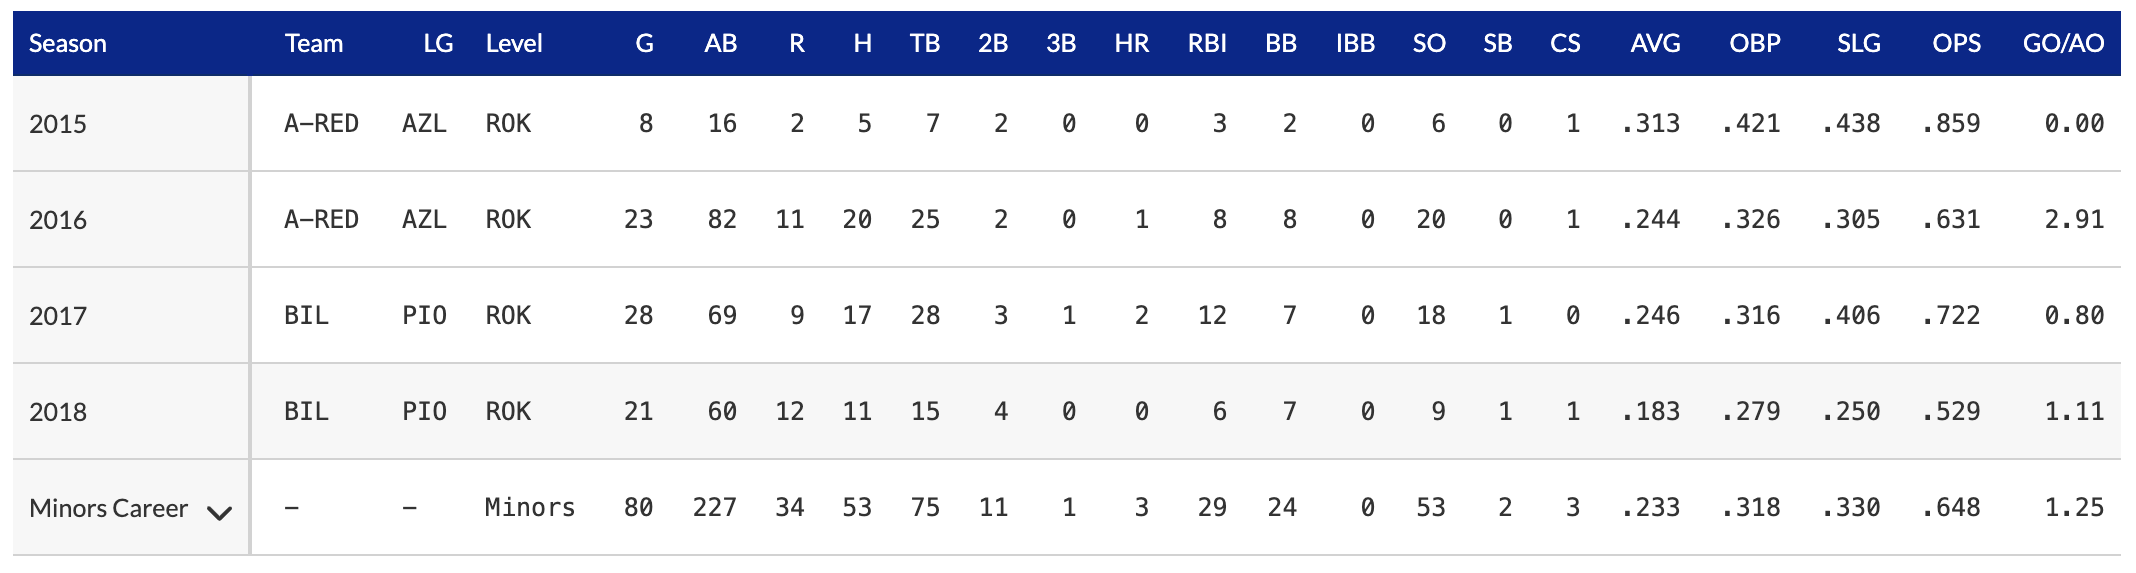
The ‘Educated Guess’ Comparisons
3 of the 17 hitters did not have as simple comparisons for OPS between 2016 and 2017. Below, we show an example of one hitter for whom we could only compare 2016 (AZL) to 2017 (Low A, or “A(Full)”). Hitting at Low A is more difficult than at AZL. So choosing this comparison makes our claim of impact on OPS more conservative. The results from milb.com are shown below:
Summary
Across 17 hitters, an AZL org affiliate saw marked improvements in their OPS on-field while improving pitch and zone recognition skills in uHIT. Deployed before uHIT Custom, all hitters used uHIT Plus (see here) and did 6-minute sessions for each scale over a 2-month period in 2016. The hitters of the affiliate did 23 (+/-2) sessions over that short season period. In this Part 2 of MLB org training case study, we looked at the effects on their OPS for the following season. This hypothesis was informed by an earlier example of year-over-year effects for one of our Korean Baseball clients (see here). In this study, we confirmed this effect with a greater sample size.